sinc(x)
The sinc function is $\sin(\pi x)/(\pi x)$ .
Note the normalization factor of pi
used in the definition. This is the most commonly used definition in signal processing. Use sinc(x / np.pi)
to obtain the unnormalized sinc function :None:math:`\sin(x)/(x)` that is more common in mathematics.
sinc(0)
is the limit value 1.
The name sinc is short for "sine cardinal" or "sinus cardinalis".
The sinc function is used in various signal processing applications, including in anti-aliasing, in the construction of a Lanczos resampling filter, and in interpolation.
For bandlimited interpolation of discrete-time signals, the ideal interpolation kernel is proportional to the sinc function.
Array (possibly multi-dimensional) of values for which to to calculate sinc(x)
.
sinc(x)
, which has the same shape as the input.
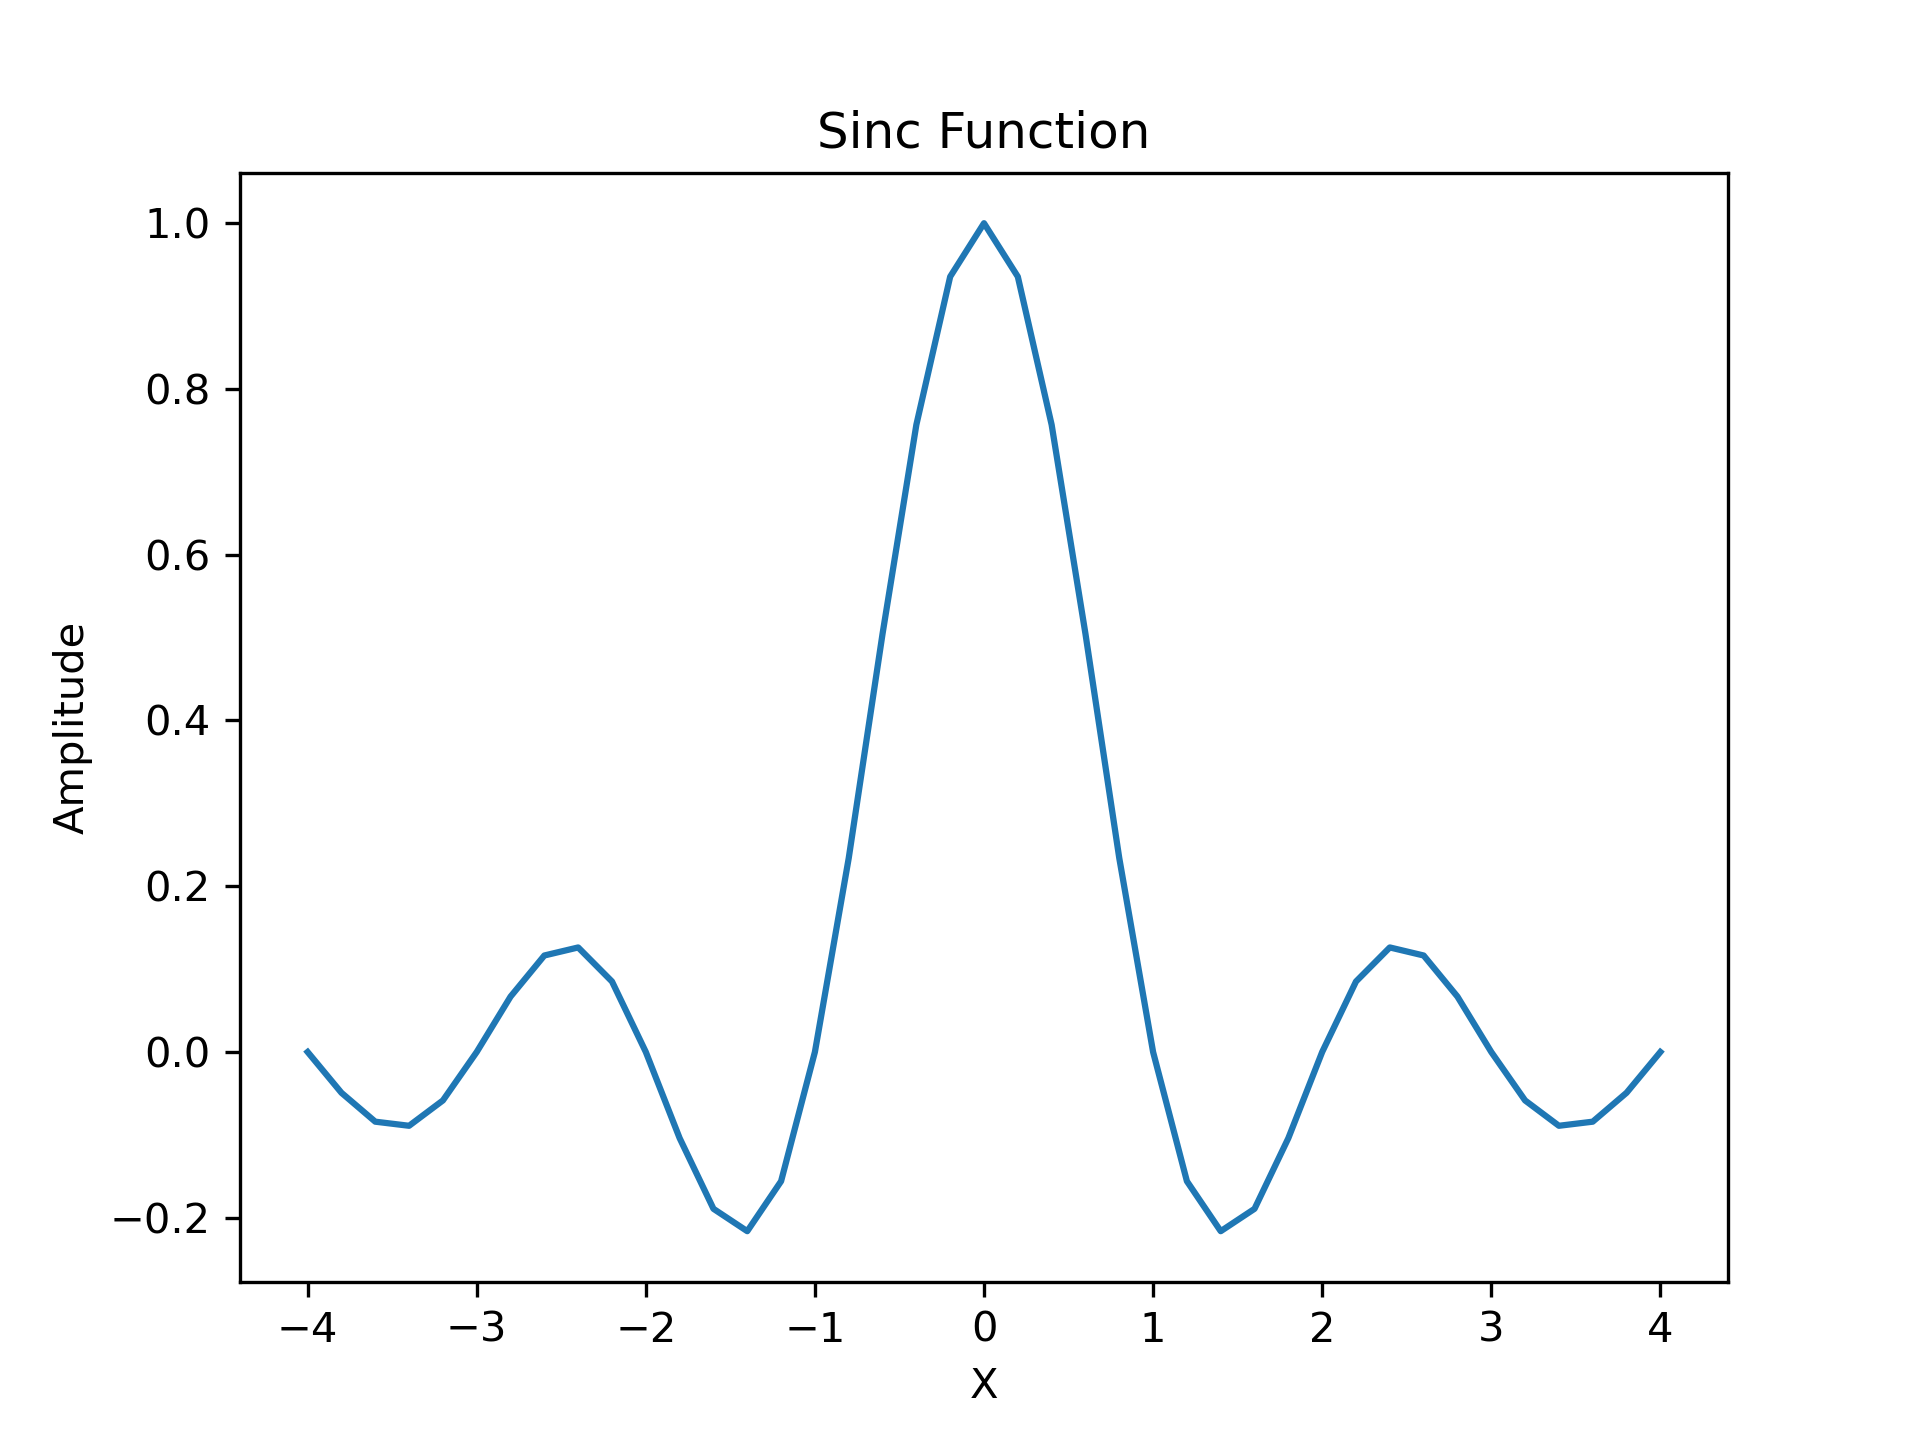
Return the normalized sinc function.
>>> import matplotlib.pyplot as plt
... x = np.linspace(-4, 4, 41)
... np.sinc(x)
 array([-3.89804309e-17,  -4.92362781e-02,  -8.40918587e-02, # may vary
        -8.90384387e-02,  -5.84680802e-02,   3.89804309e-17,
        6.68206631e-02,   1.16434881e-01,   1.26137788e-01,
        8.50444803e-02,  -3.89804309e-17,  -1.03943254e-01,
        -1.89206682e-01,  -2.16236208e-01,  -1.55914881e-01,
        3.89804309e-17,   2.33872321e-01,   5.04551152e-01,
        7.56826729e-01,   9.35489284e-01,   1.00000000e+00,
        9.35489284e-01,   7.56826729e-01,   5.04551152e-01,
        2.33872321e-01,   3.89804309e-17,  -1.55914881e-01,
       -2.16236208e-01,  -1.89206682e-01,  -1.03943254e-01,
       -3.89804309e-17,   8.50444803e-02,   1.26137788e-01,
        1.16434881e-01,   6.68206631e-02,   3.89804309e-17,
        -5.84680802e-02,  -8.90384387e-02,  -8.40918587e-02,
        -4.92362781e-02,  -3.89804309e-17])
>>> plt.plot(x, np.sinc(x))
[<matplotlib.lines.Line2D object at 0x...>]
>>> plt.title("Sinc Function")
Text(0.5, 1.0, 'Sinc Function')
>>> plt.ylabel("Amplitude")
Text(0, 0.5, 'Amplitude')
>>> plt.xlabel("X")
Text(0.5, 0, 'X')
>>> plt.show()
The following pages refer to to this document either explicitly or contain code examples using this.
dask.array.ufunc.wrap_elemwise.<locals>.wrapped
Hover to see nodes names; edges to Self not shown, Caped at 50 nodes.
Using a canvas is more power efficient and can get hundred of nodes ; but does not allow hyperlinks; , arrows or text (beyond on hover)
SVG is more flexible but power hungry; and does not scale well to 50 + nodes.
All aboves nodes referred to, (or are referred from) current nodes; Edges from Self to other have been omitted (or all nodes would be connected to the central node "self" which is not useful). Nodes are colored by the library they belong to, and scaled with the number of references pointing them