histogram2d(x, y, bins=10, range=None, normed=None, weights=None, density=None)
When :None:None:`normed` is True, then the returned histogram is the sample density, defined such that the sum over bins of the product bin_value * bin_area
is 1.
Please note that the histogram does not follow the Cartesian convention where x values are on the abscissa and y values on the ordinate axis. Rather, x is histogrammed along the first dimension of the array (vertical), and y along the second dimension of the array (horizontal). This ensures compatibility with histogramdd
.
An array containing the x coordinates of the points to be histogrammed.
An array containing the y coordinates of the points to be histogrammed.
The bin specification:
If int, the number of bins for the two dimensions (nx=ny=bins).
If array_like, the bin edges for the two dimensions (x_edges=y_edges=bins).
If [int, int], the number of bins in each dimension (nx, ny = bins).
If [array, array], the bin edges in each dimension (x_edges, y_edges = bins).
A combination [int, array] or [array, int], where int is the number of bins and array is the bin edges.
The leftmost and rightmost edges of the bins along each dimension (if not specified explicitly in the :None:None:`bins` parameters): [[xmin, xmax], [ymin, ymax]]
. All values outside of this range will be considered outliers and not tallied in the histogram.
If False, the default, returns the number of samples in each bin. If True, returns the probability density function at the bin, bin_count / sample_count / bin_area
.
An alias for the density argument that behaves identically. To avoid confusion with the broken normed argument to histogram
, :None:None:`density` should be preferred.
An array of values w_i
weighing each sample (x_i, y_i)
. Weights are normalized to 1 if :None:None:`normed` is True. If :None:None:`normed` is False, the values of the returned histogram are equal to the sum of the weights belonging to the samples falling into each bin.
The bi-dimensional histogram of samples x and y. Values in x are histogrammed along the first dimension and values in y are histogrammed along the second dimension.
The bin edges along the first dimension.
The bin edges along the second dimension.
Compute the bi-dimensional histogram of two data samples.
histogram
1D histogram
histogramdd
Multidimensional histogram
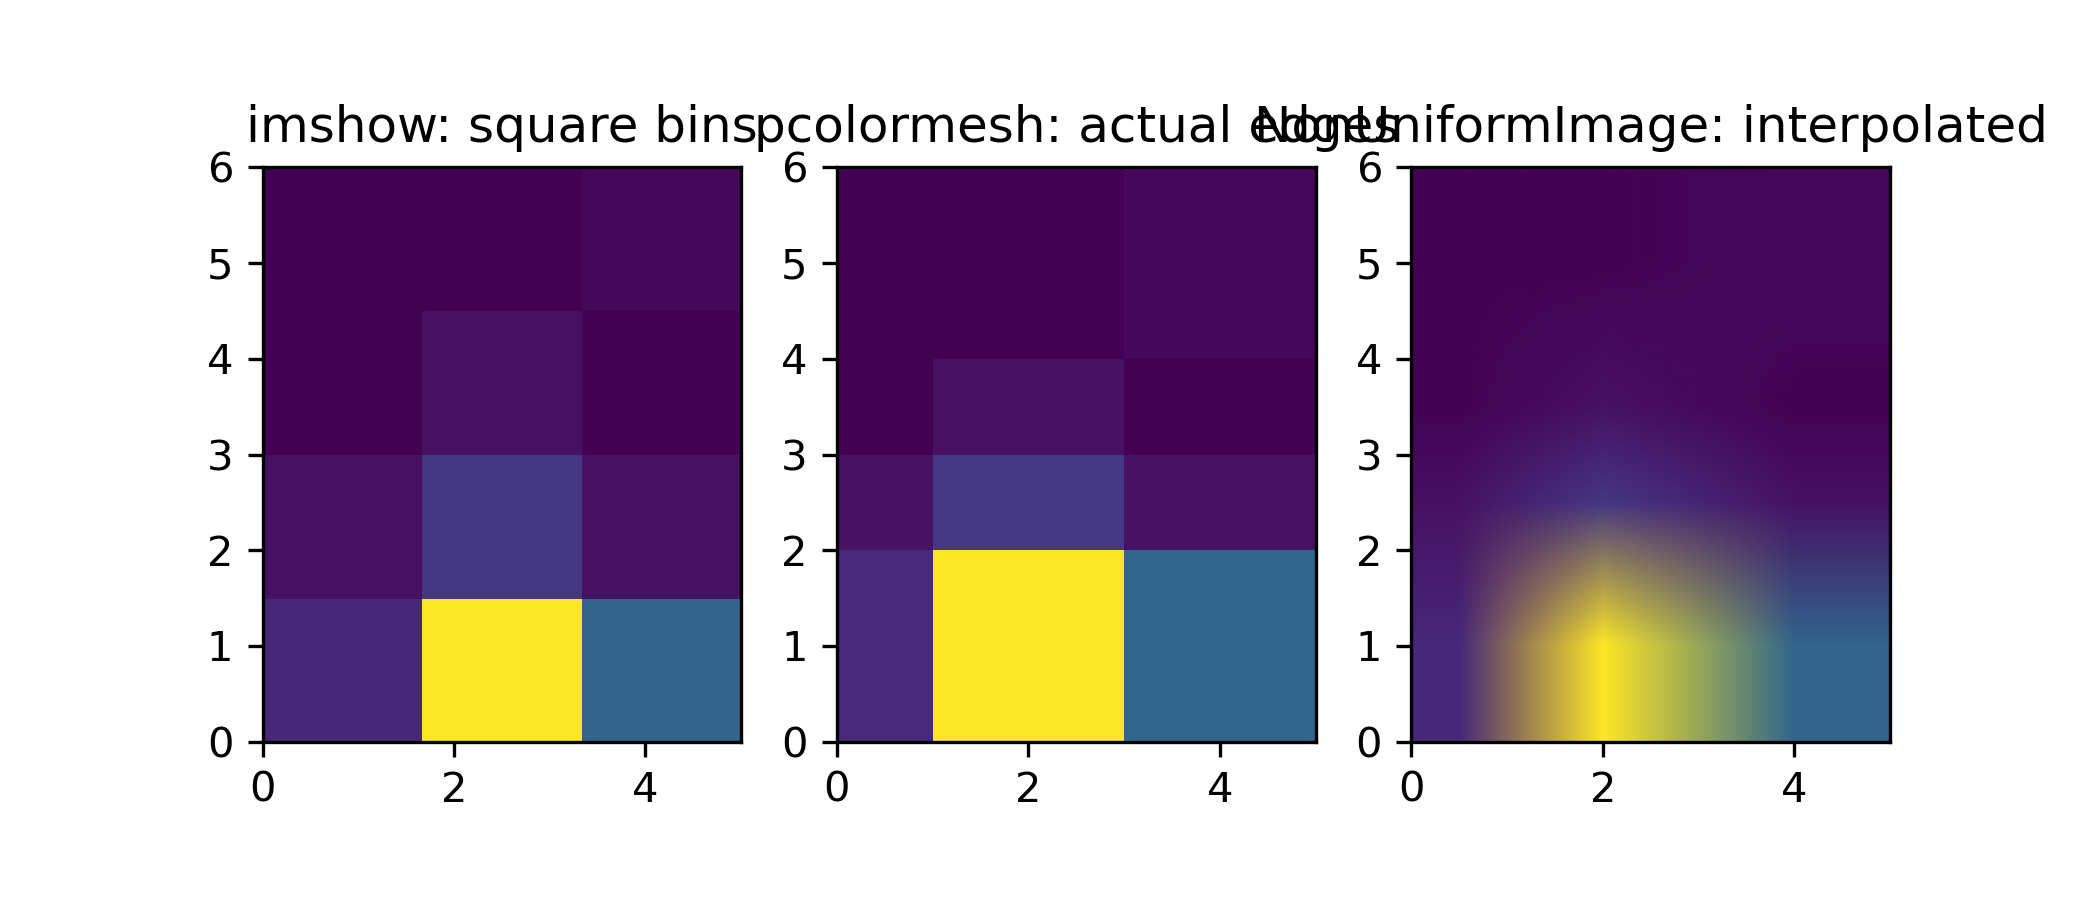
>>> from matplotlib.image import NonUniformImage
... import matplotlib.pyplot as plt
Construct a 2-D histogram with variable bin width. First define the bin edges:
>>> xedges = [0, 1, 3, 5]
... yedges = [0, 2, 3, 4, 6]
Next we create a histogram H with random bin content:
>>> x = np.random.normal(2, 1, 100)
... y = np.random.normal(1, 1, 100)
... H, xedges, yedges = np.histogram2d(x, y, bins=(xedges, yedges))
... # Histogram does not follow Cartesian convention (see Notes),
... # therefore transpose H for visualization purposes.
... H = H.T
imshow <matplotlib.pyplot.imshow>
can only display square bins:
>>> fig = plt.figure(figsize=(7, 3))
... ax = fig.add_subplot(131, title='imshow: square bins')
... plt.imshow(H, interpolation='nearest', origin='lower',
...         extent=[xedges[0], xedges[-1], yedges[0], yedges[-1]])
<matplotlib.image.AxesImage object at 0x...>
pcolormesh <matplotlib.pyplot.pcolormesh>
can display actual edges:
>>> ax = fig.add_subplot(132, title='pcolormesh: actual edges',
...         aspect='equal')
... X, Y = np.meshgrid(xedges, yedges)
... ax.pcolormesh(X, Y, H)
<matplotlib.collections.QuadMesh object at 0x...>
NonUniformImage <matplotlib.image.NonUniformImage>
can be used to display actual bin edges with interpolation:
>>> ax = fig.add_subplot(133, title='NonUniformImage: interpolated',
...         aspect='equal', xlim=xedges[[0, -1]], ylim=yedges[[0, -1]])
... im = NonUniformImage(ax, interpolation='bilinear')
... xcenters = (xedges[:-1] + xedges[1:]) / 2
... ycenters = (yedges[:-1] + yedges[1:]) / 2
... im.set_data(xcenters, ycenters, H)
... ax.images.append(im)
... plt.show()
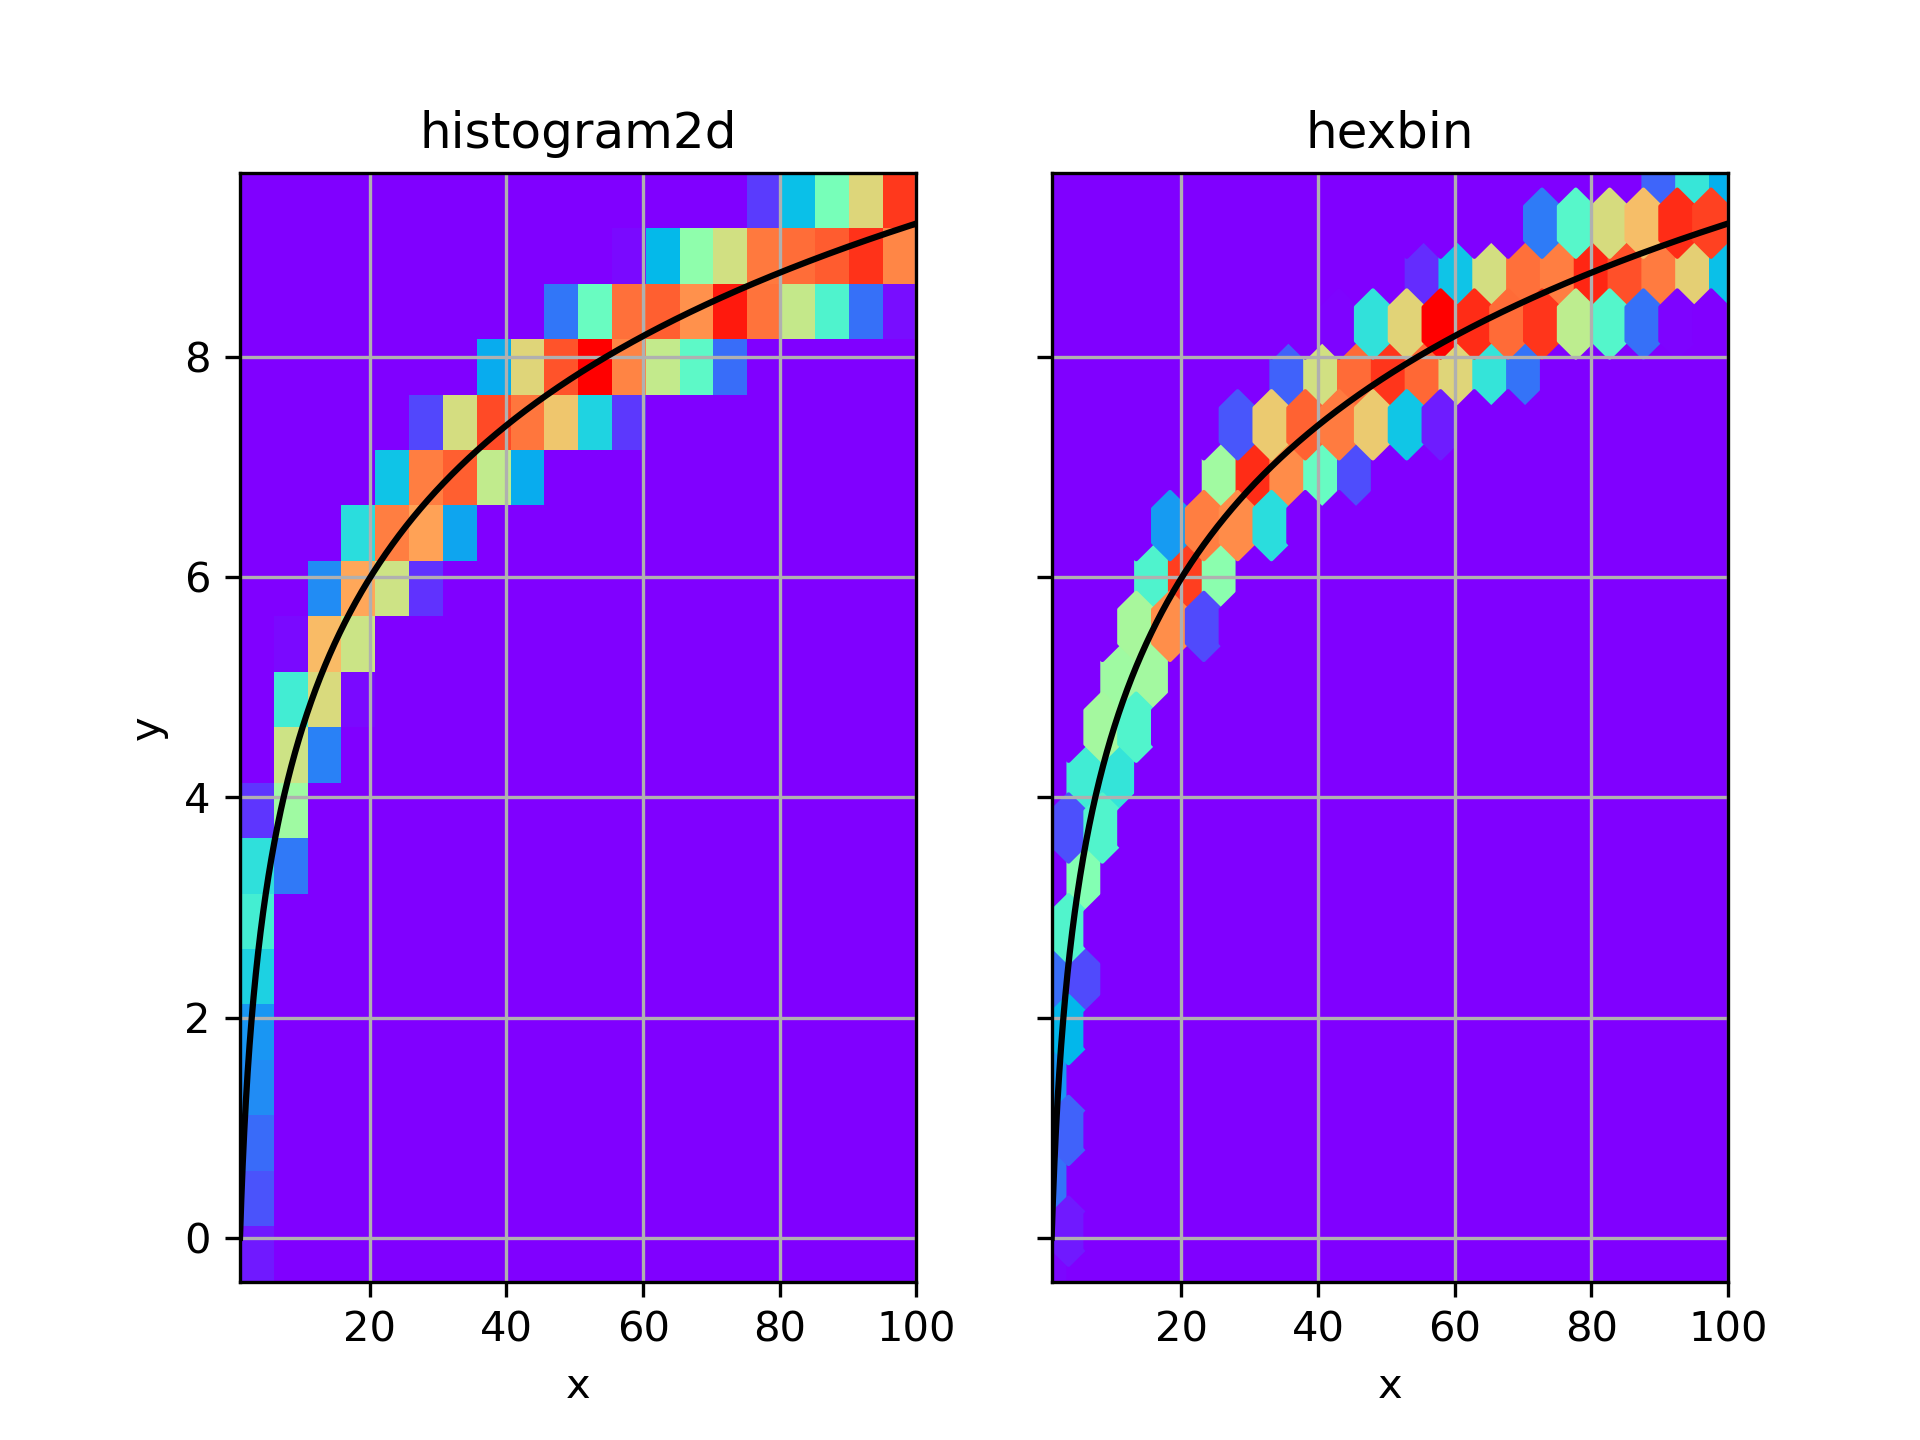
It is also possible to construct a 2-D histogram without specifying bin edges:
>>> # Generate non-symmetric test data
... n = 10000
... x = np.linspace(1, 100, n)
... y = 2*np.log(x) + np.random.rand(n) - 0.5
... # Compute 2d histogram. Note the order of x/y and xedges/yedges
... H, yedges, xedges = np.histogram2d(y, x, bins=20)
Now we can plot the histogram using pcolormesh <matplotlib.pyplot.pcolormesh>
, and a hexbin <matplotlib.pyplot.hexbin>
for comparison.
>>> # Plot histogram using pcolormesh
... fig, (ax1, ax2) = plt.subplots(ncols=2, sharey=True)
... ax1.pcolormesh(xedges, yedges, H, cmap='rainbow')
... ax1.plot(x, 2*np.log(x), 'k-')
... ax1.set_xlim(x.min(), x.max())
... ax1.set_ylim(y.min(), y.max())
... ax1.set_xlabel('x')
... ax1.set_ylabel('y')
... ax1.set_title('histogram2d')
... ax1.grid()
>>> # Create hexbin plot for comparison
... ax2.hexbin(x, y, gridsize=20, cmap='rainbow')
... ax2.plot(x, 2*np.log(x), 'k-')
... ax2.set_title('hexbin')
... ax2.set_xlim(x.min(), x.max())
... ax2.set_xlabel('x')
... ax2.grid()
>>> plt.show()
The following pages refer to to this document either explicitly or contain code examples using this.
numpy.histogramdd
Hover to see nodes names; edges to Self not shown, Caped at 50 nodes.
Using a canvas is more power efficient and can get hundred of nodes ; but does not allow hyperlinks; , arrows or text (beyond on hover)
SVG is more flexible but power hungry; and does not scale well to 50 + nodes.
All aboves nodes referred to, (or are referred from) current nodes; Edges from Self to other have been omitted (or all nodes would be connected to the central node "self" which is not useful). Nodes are colored by the library they belong to, and scaled with the number of references pointing them