geomspace(start, stop, num=50, endpoint=True, dtype=None, axis=0)
This is similar to logspace
, but with endpoints specified directly. Each output sample is a constant multiple of the previous.
Non-scalar :None:None:`start` and :None:None:`stop` are now supported.
If the inputs or dtype are complex, the output will follow a logarithmic spiral in the complex plane. (There are an infinite number of spirals passing through two points; the output will follow the shortest such path.)
The starting value of the sequence.
The final value of the sequence, unless :None:None:`endpoint` is False. In that case, num + 1
values are spaced over the interval in log-space, of which all but the last (a sequence of length :None:None:`num`) are returned.
Number of samples to generate. Default is 50.
If true, :None:None:`stop` is the last sample. Otherwise, it is not included. Default is True.
The type of the output array. If dtype
is not given, the data type is inferred from :None:None:`start` and :None:None:`stop`. The inferred dtype will never be an integer; :None:None:`float` is chosen even if the arguments would produce an array of integers.
The axis in the result to store the samples. Relevant only if start or stop are array-like. By default (0), the samples will be along a new axis inserted at the beginning. Use -1 to get an axis at the end.
:None:None:`num` samples, equally spaced on a log scale.
Return numbers spaced evenly on a log scale (a geometric progression).
arange
Similar to linspace, with the step size specified instead of the number of samples.
linspace
Similar to geomspace, but with arithmetic instead of geometric progression.
logspace
Similar to geomspace, but with endpoints specified using log and base.
>>> np.geomspace(1, 1000, num=4)
array([    1.,    10.,   100.,  1000.])
>>> np.geomspace(1, 1000, num=3, endpoint=False)
array([   1.,   10.,  100.])
>>> np.geomspace(1, 1000, num=4, endpoint=False)
array([   1.        ,    5.62341325,   31.6227766 ,  177.827941  ])
>>> np.geomspace(1, 256, num=9)
array([   1.,    2.,    4.,    8.,   16.,   32.,   64.,  128.,  256.])
Note that the above may not produce exact integers:
>>> np.geomspace(1, 256, num=9, dtype=int)
array([  1,   2,   4,   7,  16,  32,  63, 127, 256])
>>> np.around(np.geomspace(1, 256, num=9)).astype(int)
array([  1,   2,   4,   8,  16,  32,  64, 128, 256])
Negative, decreasing, and complex inputs are allowed:
>>> np.geomspace(1000, 1, num=4)
array([1000.,  100.,   10.,    1.])
>>> np.geomspace(-1000, -1, num=4)
array([-1000.,  -100.,   -10.,    -1.])
>>> np.geomspace(1j, 1000j, num=4)  # Straight line
array([0.   +1.j, 0.  +10.j, 0. +100.j, 0.+1000.j])
>>> np.geomspace(-1+0j, 1+0j, num=5)  # Circle
array([-1.00000000e+00+1.22464680e-16j, -7.07106781e-01+7.07106781e-01j,
        6.12323400e-17+1.00000000e+00j,  7.07106781e-01+7.07106781e-01j,
        1.00000000e+00+0.00000000e+00j])
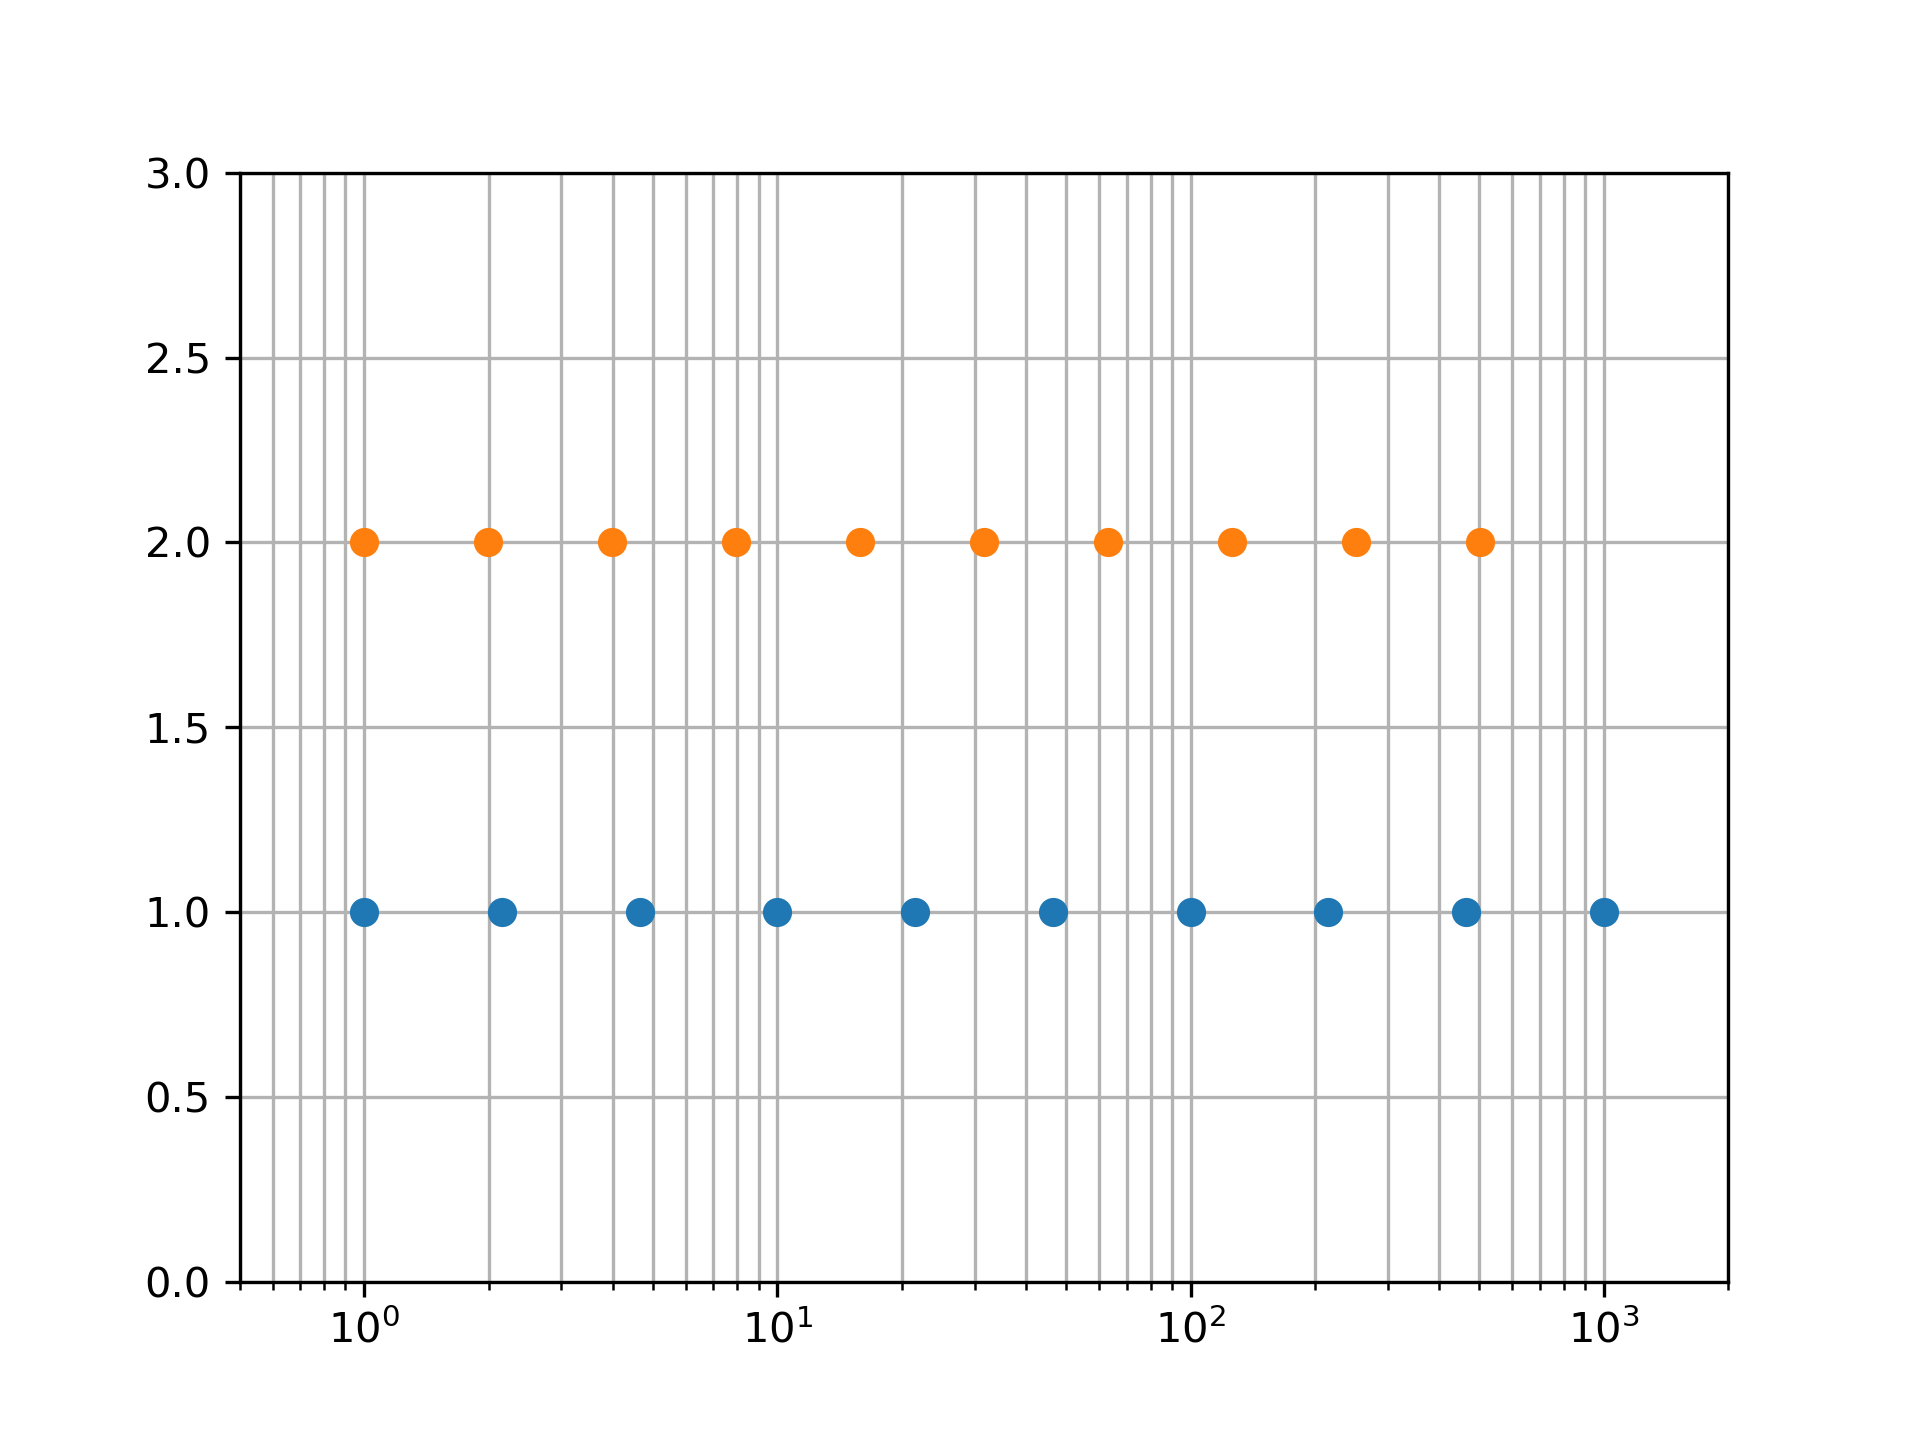
Graphical illustration of :None:None:`endpoint` parameter:
>>> import matplotlib.pyplot as plt
... N = 10
... y = np.zeros(N)
... plt.semilogx(np.geomspace(1, 1000, N, endpoint=True), y + 1, 'o')
[<matplotlib.lines.Line2D object at 0x...>]
>>> plt.semilogx(np.geomspace(1, 1000, N, endpoint=False), y + 2, 'o')
[<matplotlib.lines.Line2D object at 0x...>]
>>> plt.axis([0.5, 2000, 0, 3])
[0.5, 2000, 0, 3]
>>> plt.grid(True, color='0.7', linestyle='-', which='both', axis='both')
... plt.show()
The following pages refer to to this document either explicitly or contain code examples using this.
numpy.logspace
numpy.linspace
Hover to see nodes names; edges to Self not shown, Caped at 50 nodes.
Using a canvas is more power efficient and can get hundred of nodes ; but does not allow hyperlinks; , arrows or text (beyond on hover)
SVG is more flexible but power hungry; and does not scale well to 50 + nodes.
All aboves nodes referred to, (or are referred from) current nodes; Edges from Self to other have been omitted (or all nodes would be connected to the central node "self" which is not useful). Nodes are colored by the library they belong to, and scaled with the number of references pointing them