histogram(a, bins=10, range=None, normed=None, weights=None, density=None)
All but the last (righthand-most) bin is half-open. In other words, if :None:None:`bins` is:
[1, 2, 3, 4]
then the first bin is [1, 2)
(including 1, but excluding 2) and the second [2, 3)
. The last bin, however, is [3, 4]
, which includes 4.
Input data. The histogram is computed over the flattened array.
If :None:None:`bins` is an int, it defines the number of equal-width bins in the given range (10, by default). If :None:None:`bins` is a sequence, it defines a monotonically increasing array of bin edges, including the rightmost edge, allowing for non-uniform bin widths.
If :None:None:`bins` is a string, it defines the method used to calculate the optimal bin width, as defined by histogram_bin_edges
.
The lower and upper range of the bins. If not provided, range is simply (a.min(), a.max())
. Values outside the range are ignored. The first element of the range must be less than or equal to the second. :None:None:`range` affects the automatic bin computation as well. While bin width is computed to be optimal based on the actual data within :None:None:`range`, the bin count will fill the entire range including portions containing no data.
This is equivalent to the :None:None:`density` argument, but produces incorrect results for unequal bin widths. It should not be used.
DeprecationWarnings are actually emitted.
An array of weights, of the same shape as a. Each value in a only contributes its associated weight towards the bin count (instead of 1). If :None:None:`density` is True, the weights are normalized, so that the integral of the density over the range remains 1.
If False
, the result will contain the number of samples in each bin. If True
, the result is the value of the probability density function at the bin, normalized such that the integral over the range is 1. Note that the sum of the histogram values will not be equal to 1 unless bins of unity width are chosen; it is not a probability mass function.
Overrides the normed
keyword if given.
The values of the histogram. See :None:None:`density` and weights
for a description of the possible semantics.
Return the bin edges (length(hist)+1)
.
Compute the histogram of a dataset.
>>> np.histogram([1, 2, 1], bins=[0, 1, 2, 3])
(array([0, 2, 1]), array([0, 1, 2, 3]))
>>> np.histogram(np.arange(4), bins=np.arange(5), density=True)
(array([0.25, 0.25, 0.25, 0.25]), array([0, 1, 2, 3, 4]))
>>> np.histogram([[1, 2, 1], [1, 0, 1]], bins=[0,1,2,3])
(array([1, 4, 1]), array([0, 1, 2, 3]))
>>> a = np.arange(5)
... hist, bin_edges = np.histogram(a, density=True)
... hist
array([0.5, 0. , 0.5, 0. , 0. , 0.5, 0. , 0.5, 0. , 0.5])
>>> hist.sum()
2.4999999999999996
>>> np.sum(hist * np.diff(bin_edges))
1.0
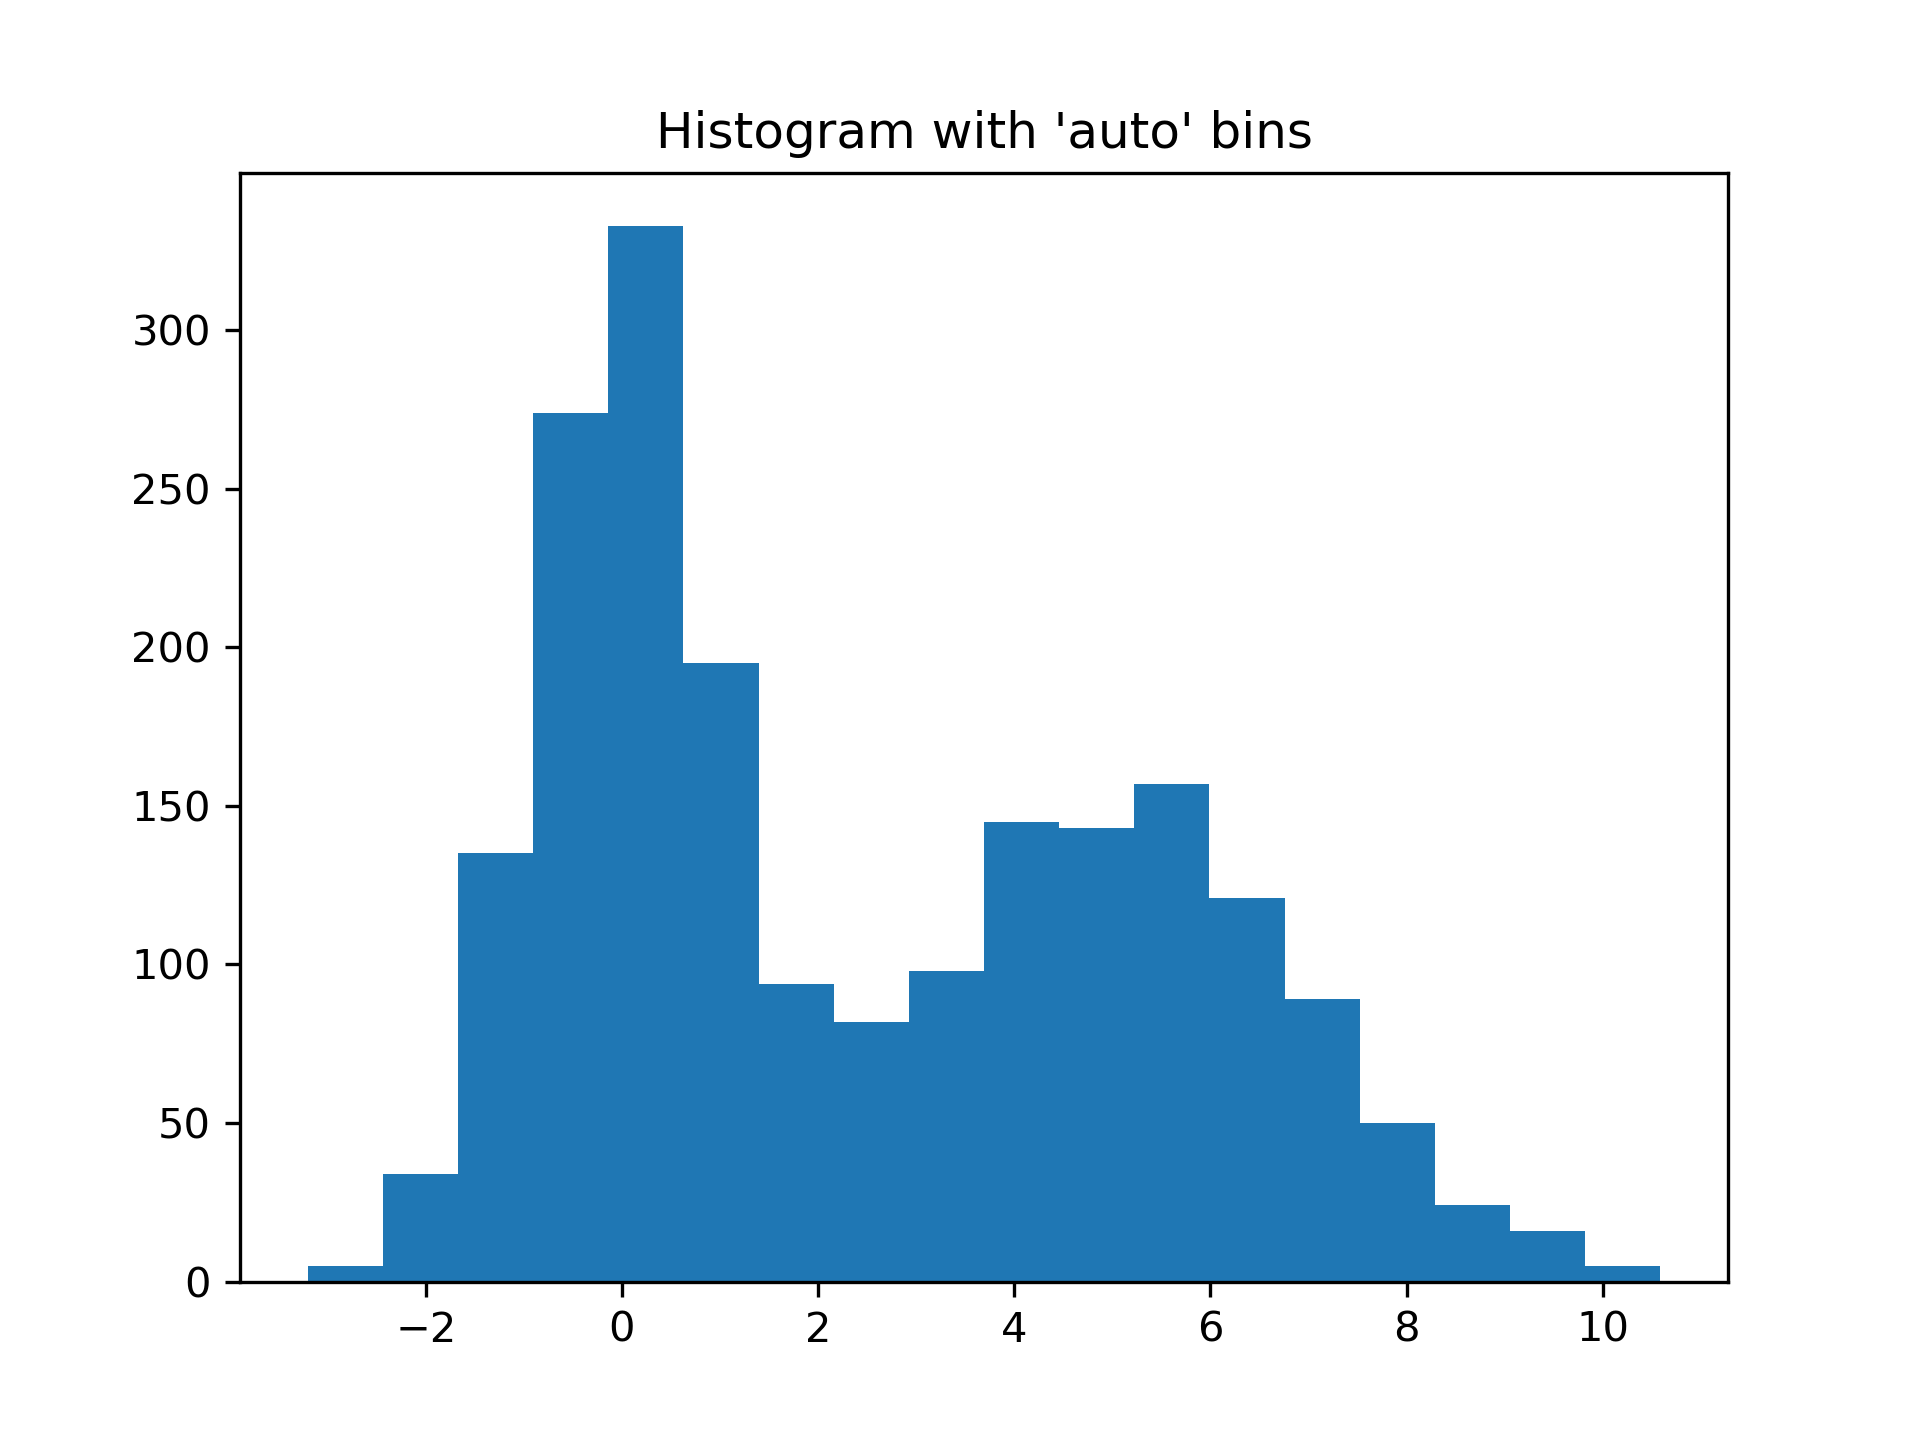
Automated Bin Selection Methods example, using 2 peak random data with 2000 points:
>>> import matplotlib.pyplot as plt
... rng = np.random.RandomState(10)  # deterministic random data
... a = np.hstack((rng.normal(size=1000),
...                rng.normal(loc=5, scale=2, size=1000)))
... _ = plt.hist(a, bins='auto')  # arguments are passed to np.histogram
... plt.title("Histogram with 'auto' bins")
Text(0.5, 1.0, "Histogram with 'auto' bins")
>>> plt.show()
The following pages refer to to this document either explicitly or contain code examples using this.
numpy.bincount
matplotlib.pyplot.hist
numpy.histogramdd
numpy.isscalar
numpy.core._multiarray_umath.bincount
matplotlib.axes._axes.Axes.hist
numpy.lib.histograms._get_bin_edges
dask.array.random.RandomState.noncentral_f
skimage.exposure.exposure.histogram
numpy.digitize
numpy.histogram_bin_edges
numpy.searchsorted
numpy.histogram2d
Hover to see nodes names; edges to Self not shown, Caped at 50 nodes.
Using a canvas is more power efficient and can get hundred of nodes ; but does not allow hyperlinks; , arrows or text (beyond on hover)
SVG is more flexible but power hungry; and does not scale well to 50 + nodes.
All aboves nodes referred to, (or are referred from) current nodes; Edges from Self to other have been omitted (or all nodes would be connected to the central node "self" which is not useful). Nodes are colored by the library they belong to, and scaled with the number of references pointing them