decimate(x, q, n=None, ftype='iir', axis=-1, zero_phase=True)
By default, an order 8 Chebyshev type I filter is used. A 30 point FIR filter with Hamming window is used if :None:None:`ftype` is 'fir'.
The zero_phase
keyword was added in 0.18.0. The possibility to use instances of dlti
as ftype
was added in 0.18.0.
The signal to be downsampled, as an N-dimensional array.
The downsampling factor. When using IIR downsampling, it is recommended to call decimate
multiple times for downsampling factors higher than 13.
The order of the filter (1 less than the length for 'fir'). Defaults to 8 for 'iir' and 20 times the downsampling factor for 'fir'.
If 'iir' or 'fir', specifies the type of lowpass filter. If an instance of an dlti
object, uses that object to filter before downsampling.
The axis along which to decimate.
Prevent phase shift by filtering with filtfilt
instead of lfilter
when using an IIR filter, and shifting the outputs back by the filter's group delay when using an FIR filter. The default value of True
is recommended, since a phase shift is generally not desired.
The down-sampled signal.
Downsample the signal after applying an anti-aliasing filter.
resample
Resample up or down using the FFT method.
resample_poly
Resample using polyphase filtering and an FIR filter.
>>> from scipy import signal
... import matplotlib.pyplot as plt
Define wave parameters.
>>> wave_duration = 3
... sample_rate = 100
... freq = 2
... q = 5
Calculate number of samples.
>>> samples = wave_duration*sample_rate
... samples_decimated = int(samples/q)
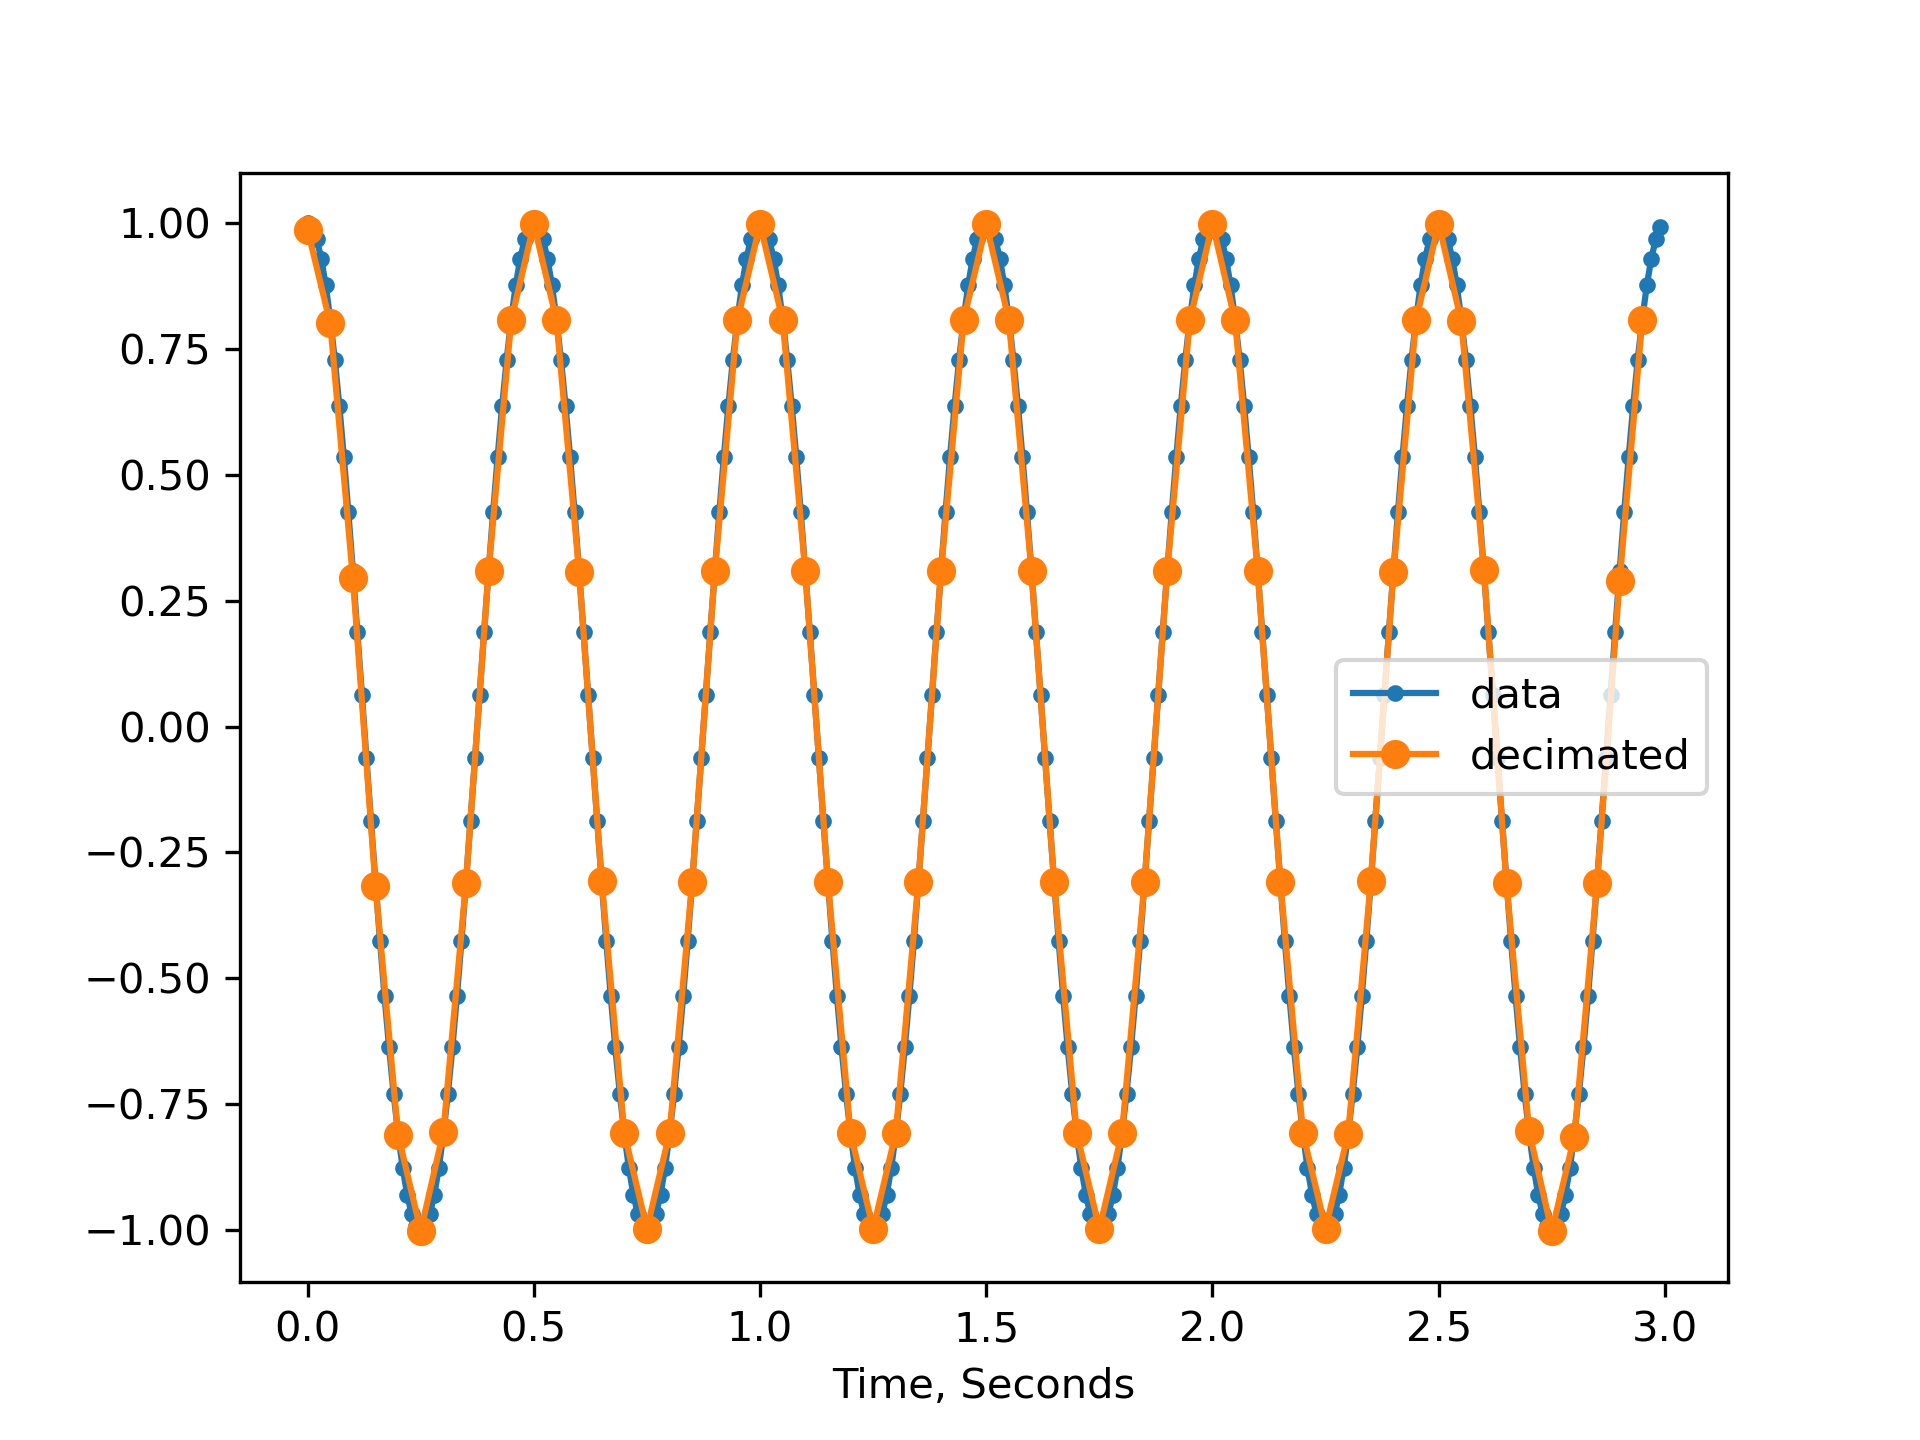
Create cosine wave.
>>> x = np.linspace(0, wave_duration, samples, endpoint=False)
... y = np.cos(x*np.pi*freq*2)
Decimate cosine wave.
>>> ydem = signal.decimate(y, q)
... xnew = np.linspace(0, wave_duration, samples_decimated, endpoint=False)
Plot original and decimated waves.
>>> plt.plot(x, y, '.-', xnew, ydem, 'o-')
... plt.xlabel('Time, Seconds')
... plt.legend(['data', 'decimated'], loc='best')
... plt.show()
The following pages refer to to this document either explicitly or contain code examples using this.
scipy.signal._signaltools.decimate
scipy.signal._signaltools.resample
scipy.signal._signaltools.resample_poly
Hover to see nodes names; edges to Self not shown, Caped at 50 nodes.
Using a canvas is more power efficient and can get hundred of nodes ; but does not allow hyperlinks; , arrows or text (beyond on hover)
SVG is more flexible but power hungry; and does not scale well to 50 + nodes.
All aboves nodes referred to, (or are referred from) current nodes; Edges from Self to other have been omitted (or all nodes would be connected to the central node "self" which is not useful). Nodes are colored by the library they belong to, and scaled with the number of references pointing them