resample(x, num, t=None, axis=0, window=None, domain='time')
The resampled signal starts at the same value as x but is sampled with a spacing of len(x) / num * (spacing of x)
. Because a Fourier method is used, the signal is assumed to be periodic.
The argument :None:None:`window` controls a Fourier-domain window that tapers the Fourier spectrum before zero-padding to alleviate ringing in the resampled values for sampled signals you didn't intend to be interpreted as band-limited.
If :None:None:`window` is a function, then it is called with a vector of inputs indicating the frequency bins (i.e. fftfreq(x.shape[axis]) ).
If :None:None:`window` is an array of the same length as :None:None:`x.shape[axis]` it is assumed to be the window to be applied directly in the Fourier domain (with dc and low-frequency first).
For any other type of :None:None:`window`, the function scipy.signal.get_window
is called to generate the window.
The first sample of the returned vector is the same as the first sample of the input vector. The spacing between samples is changed from dx
to dx * len(x) / num
.
If t is not None, then it is used solely to calculate the resampled positions :None:None:`resampled_t`
As noted, resample
uses FFT transformations, which can be very slow if the number of input or output samples is large and prime; see scipy.fft.fft
.
The data to be resampled.
The number of samples in the resampled signal.
If t is given, it is assumed to be the equally spaced sample positions associated with the signal data in x.
The axis of x that is resampled. Default is 0.
Specifies the window applied to the signal in the Fourier domain. See below for details.
A string indicating the domain of the input x: time
Consider the input x as time-domain (Default), freq
Consider the input x as frequency-domain.
Either the resampled array, or, if t was given, a tuple containing the resampled array and the corresponding resampled positions.
Resample x to :None:None:`num` samples using Fourier method along the given axis.
decimate
Downsample the signal after applying an FIR or IIR filter.
resample_poly
Resample using polyphase filtering and an FIR filter.
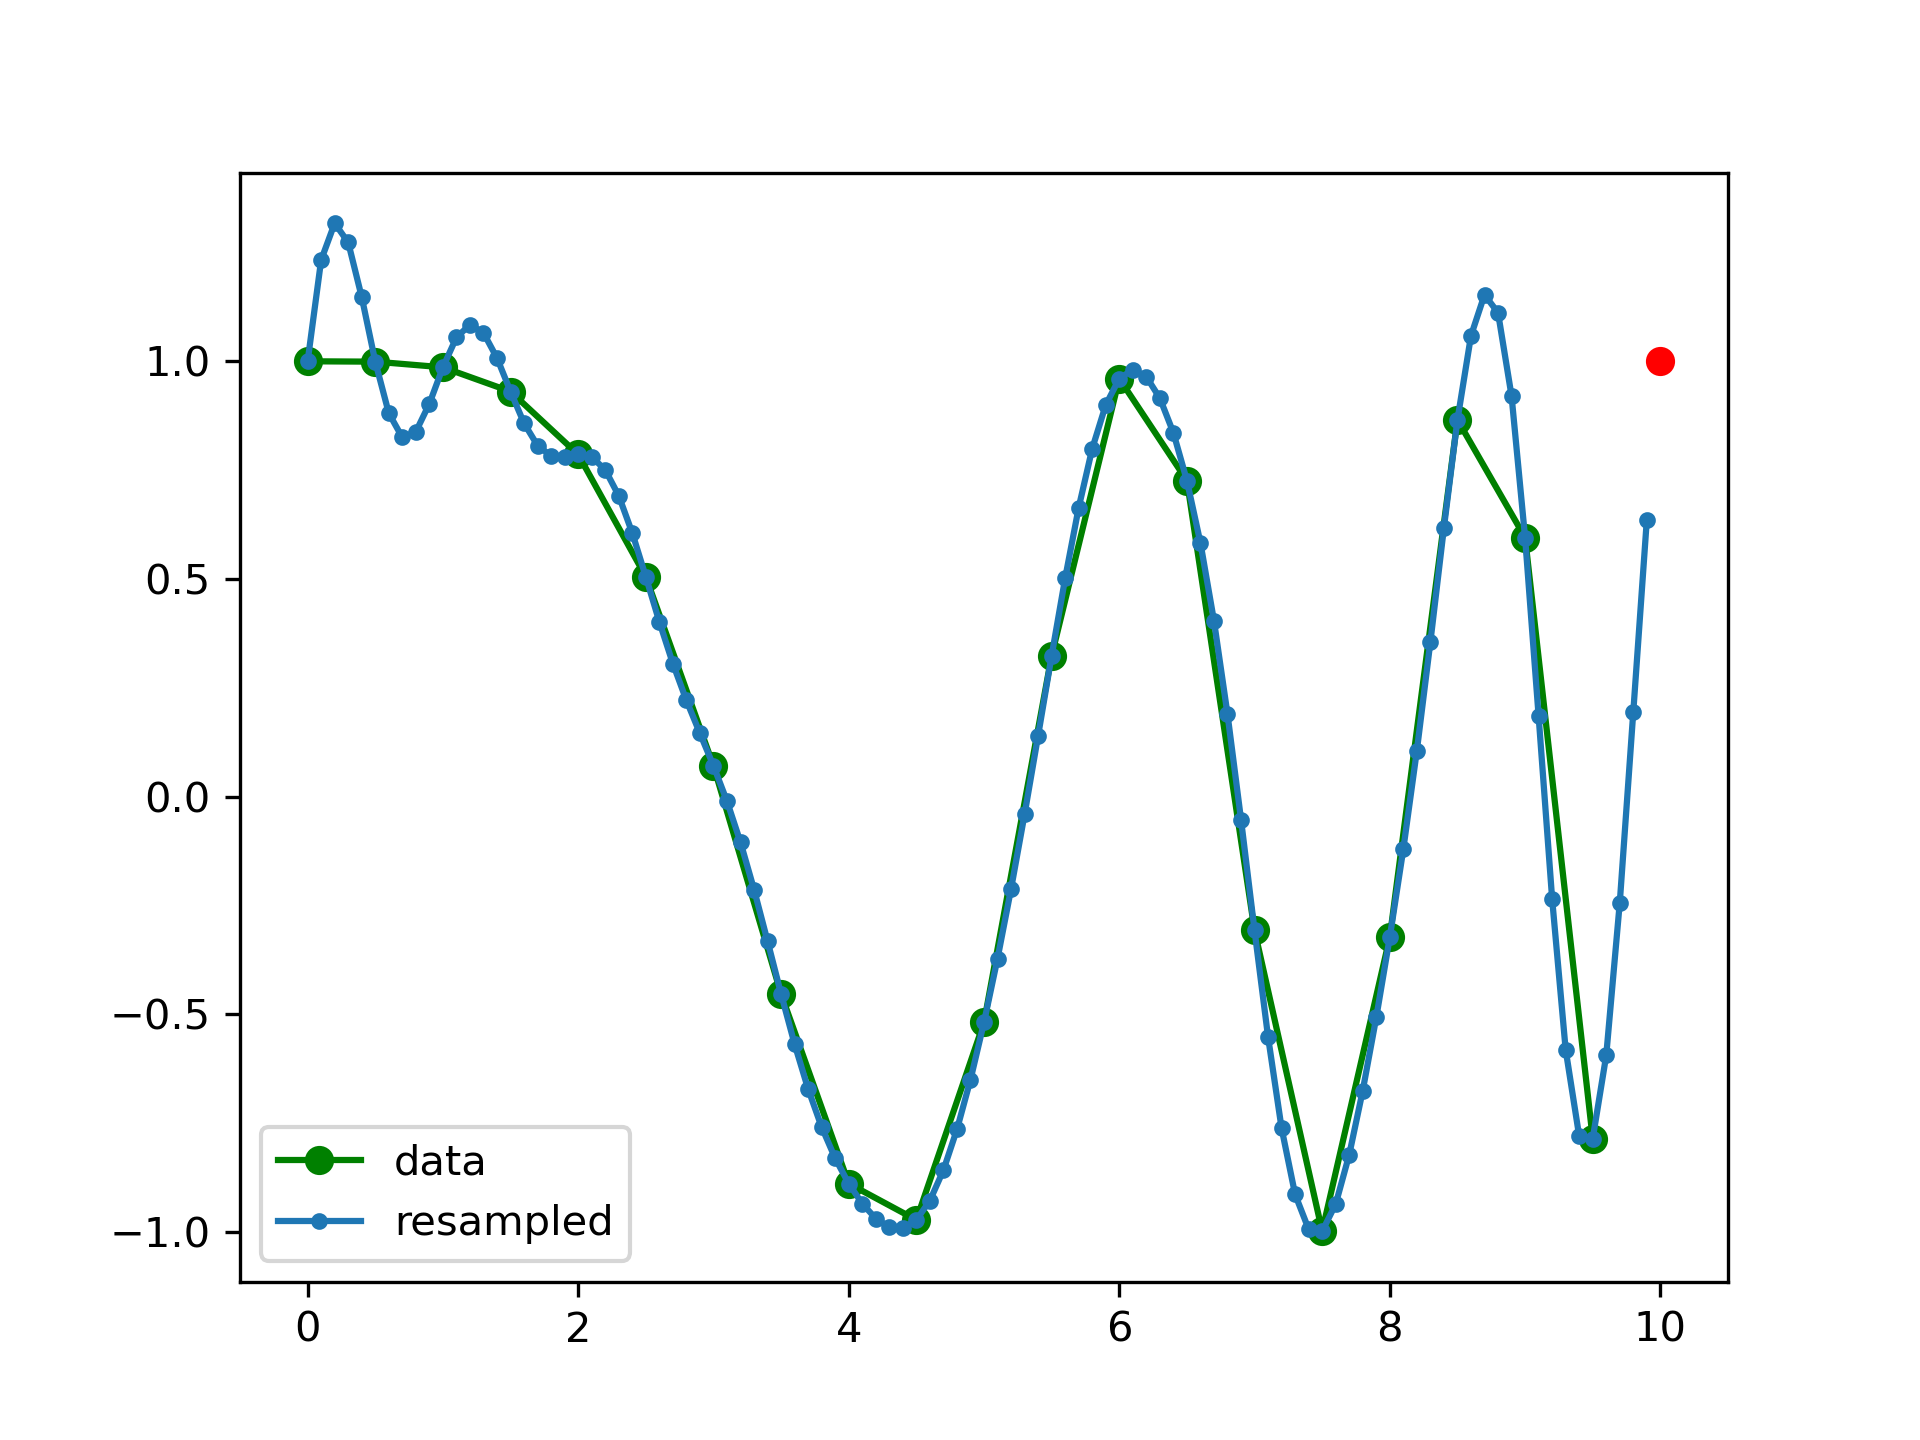
Note that the end of the resampled data rises to meet the first sample of the next cycle:
>>> from scipy import signal
>>> x = np.linspace(0, 10, 20, endpoint=False)
... y = np.cos(-x**2/6.0)
... f = signal.resample(y, 100)
... xnew = np.linspace(0, 10, 100, endpoint=False)
>>> import matplotlib.pyplot as plt
... plt.plot(x, y, 'go-', xnew, f, '.-', 10, y[0], 'ro')
... plt.legend(['data', 'resampled'], loc='best')
... plt.show()
The following pages refer to to this document either explicitly or contain code examples using this.
scipy.signal._signaltools.decimate
scipy.signal._signaltools.resample
scipy.signal._signaltools.resample_poly
Hover to see nodes names; edges to Self not shown, Caped at 50 nodes.
Using a canvas is more power efficient and can get hundred of nodes ; but does not allow hyperlinks; , arrows or text (beyond on hover)
SVG is more flexible but power hungry; and does not scale well to 50 + nodes.
All aboves nodes referred to, (or are referred from) current nodes; Edges from Self to other have been omitted (or all nodes would be connected to the central node "self" which is not useful). Nodes are colored by the library they belong to, and scaled with the number of references pointing them