gammatone(freq, ftype, order=None, numtaps=None, fs=None)
This function computes the coefficients of an FIR or IIR gammatone digital filter .
Center frequency of the filter (expressed in the same units as :None:None:`fs`).
The type of filter the function generates. If 'fir', the function will generate an Nth order FIR gammatone filter. If 'iir', the function will generate an 8th order digital IIR filter, modeled as as 4th order gammatone filter.
The order of the filter. Only used when ftype='fir'
. Default is 4 to model the human auditory system. Must be between 0 and 24.
Length of the filter. Only used when ftype='fir'
. Default is fs*0.015
if :None:None:`fs` is greater than 1000, 15 if :None:None:`fs` is less than or equal to 1000.
The sampling frequency of the signal. :None:None:`freq` must be between 0 and fs/2
. Default is 2.
If :None:None:`freq` is less than or equal to 0 or greater than or equal to fs/2
, if :None:None:`ftype` is not 'fir' or 'iir', if :None:None:`order` is less than or equal to 0 or greater than 24 when ftype='fir'
Numerator ( b
) and denominator ( a
) polynomials of the filter.
Gammatone filter design.
16-sample 4th order FIR Gammatone filter centered at 440 Hz
>>> from scipy import signal
... signal.gammatone(440, 'fir', numtaps=16, fs=16000)
(array([ 0.00000000e+00,  2.22196719e-07,  1.64942101e-06,  4.99298227e-06,
    1.01993969e-05,  1.63125770e-05,  2.14648940e-05,  2.29947263e-05,
    1.76776931e-05,  2.04980537e-06, -2.72062858e-05, -7.28455299e-05,
   -1.36651076e-04, -2.19066855e-04, -3.18905076e-04, -4.33156712e-04]),
   [1.0])
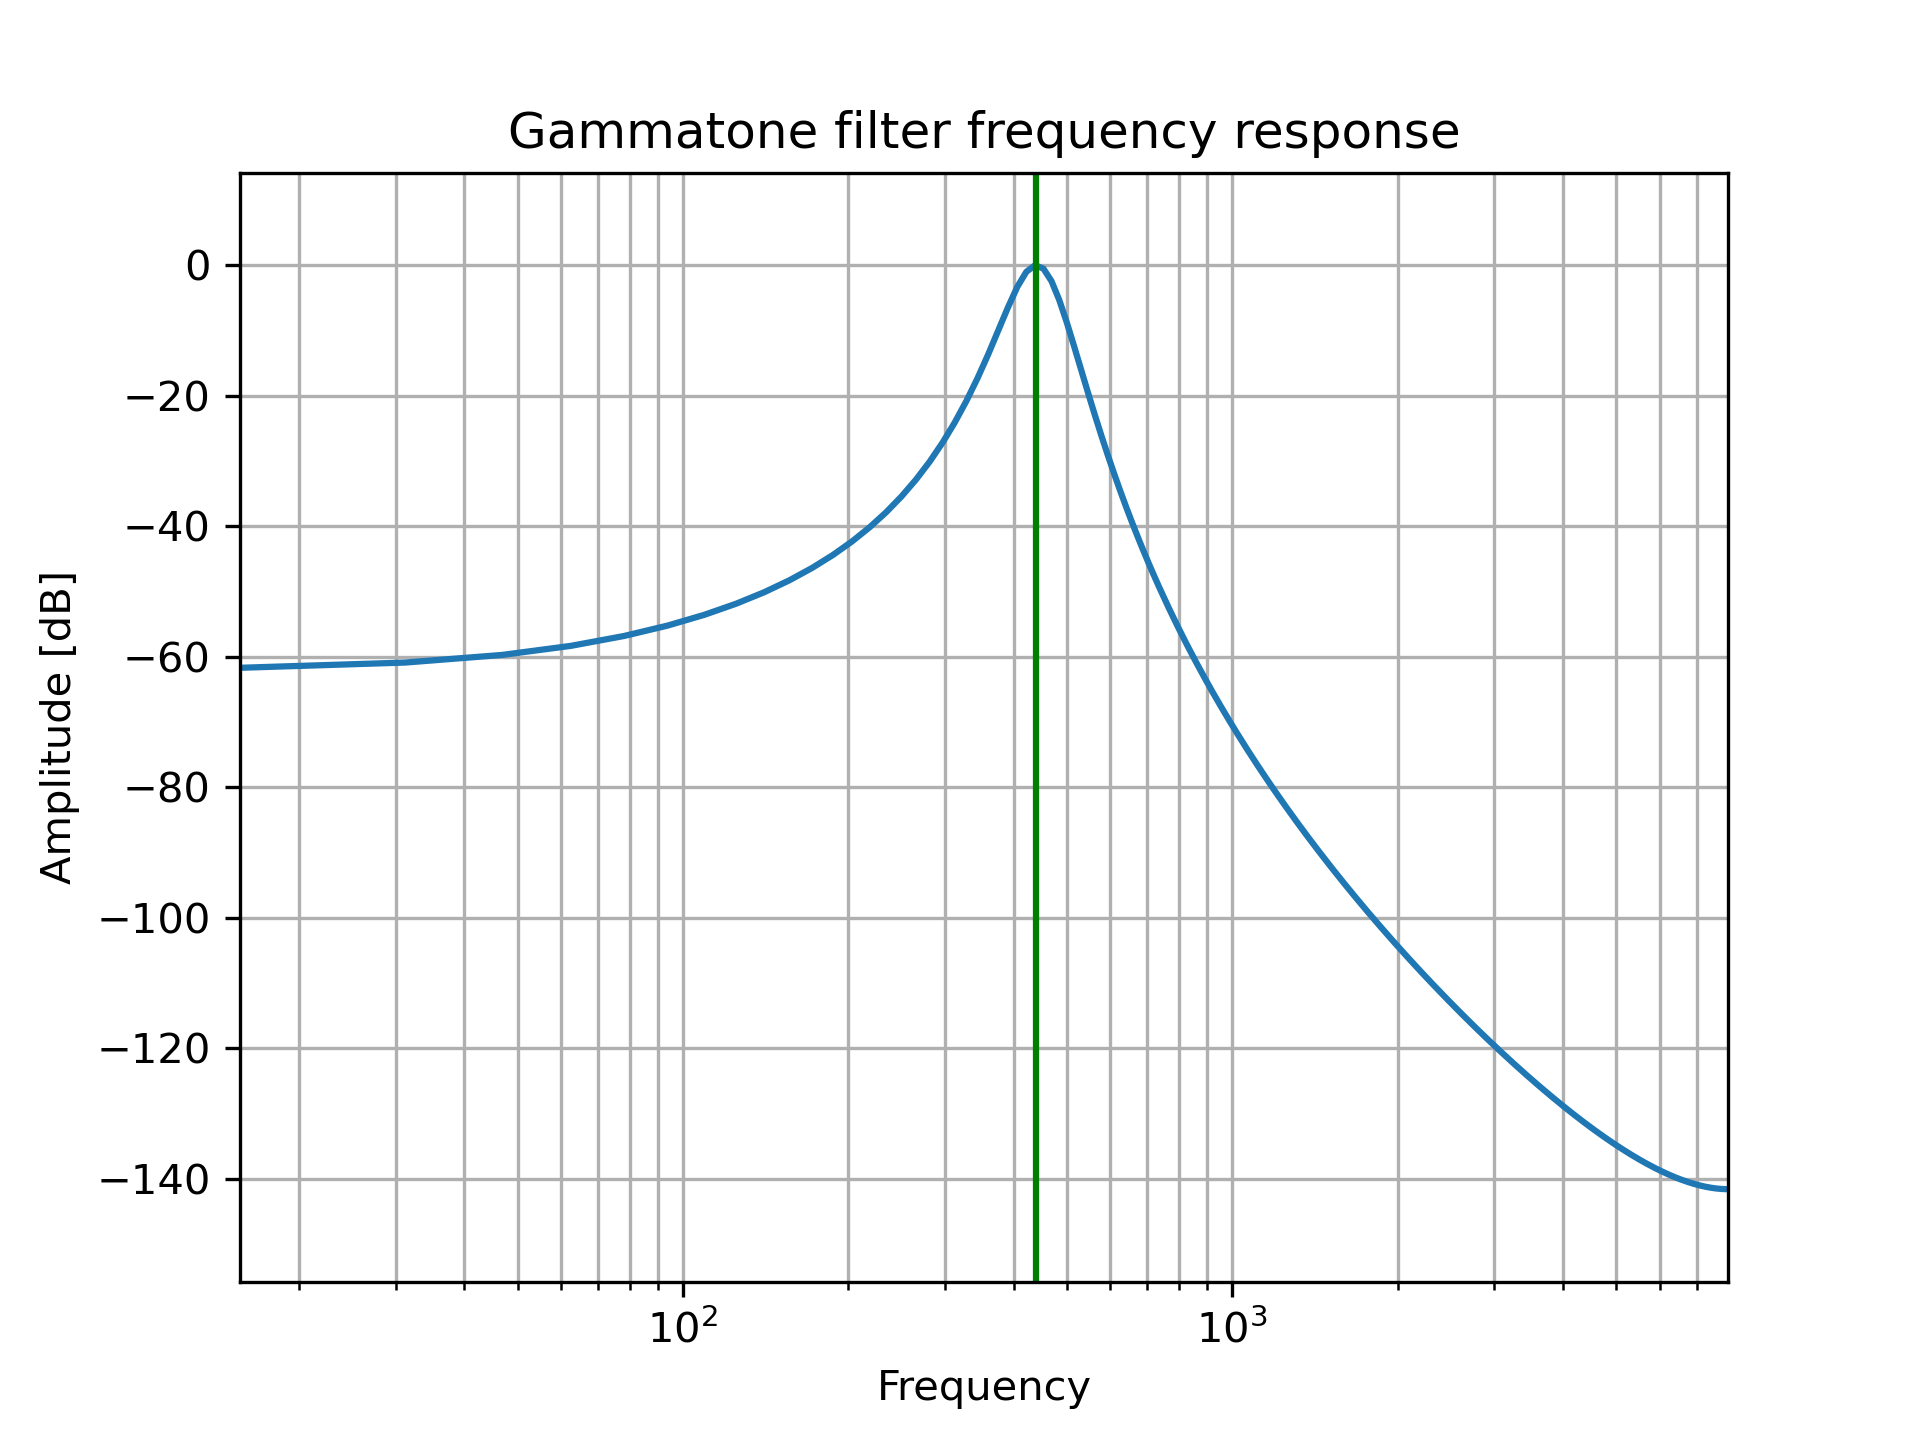
IIR Gammatone filter centered at 440 Hz
>>> from scipy import signal
... import matplotlib.pyplot as plt
>>> b, a = signal.gammatone(440, 'iir', fs=16000)
... w, h = signal.freqz(b, a)
... plt.plot(w / ((2 * np.pi) / 16000), 20 * np.log10(abs(h)))
... plt.xscale('log')
... plt.title('Gammatone filter frequency response')
... plt.xlabel('Frequency')
... plt.ylabel('Amplitude [dB]')
... plt.margins(0, 0.1)
... plt.grid(which='both', axis='both')
... plt.axvline(440, color='green') # cutoff frequency
... plt.show()
The following pages refer to to this document either explicitly or contain code examples using this.
scipy.signal._filter_design.gammatone
Hover to see nodes names; edges to Self not shown, Caped at 50 nodes.
Using a canvas is more power efficient and can get hundred of nodes ; but does not allow hyperlinks; , arrows or text (beyond on hover)
SVG is more flexible but power hungry; and does not scale well to 50 + nodes.
All aboves nodes referred to, (or are referred from) current nodes; Edges from Self to other have been omitted (or all nodes would be connected to the central node "self" which is not useful). Nodes are colored by the library they belong to, and scaled with the number of references pointing them