Fits a spline y = spl(x) of degree k to the provided x, y data. Spline function passes through all provided points. Equivalent to UnivariateSpline
with s=0.
The number of data points must be larger than the spline degree k.
Input dimension of data points -- must be strictly increasing
input dimension of data points
Weights for spline fitting. Must be positive. If None (default), weights are all equal.
2-sequence specifying the boundary of the approximation interval. If None (default), bbox=[x[0], x[-1]]
.
Degree of the smoothing spline. Must be 1 <= k <= 5.
Controls the extrapolation mode for elements not in the interval defined by the knot sequence.
if ext=0 or 'extrapolate', return the extrapolated value.
if ext=1 or 'zeros', return 0
if ext=2 or 'raise', raise a ValueError
if ext=3 of 'const', return the boundary value.
The default value is 0.
Whether to check that the input arrays contain only finite numbers. Disabling may give a performance gain, but may result in problems (crashes, non-termination or non-sensical results) if the inputs do contain infinities or NaNs. Default is False.
1-D interpolating spline for a given set of data points.
LSQBivariateSpline
a bivariate spline using weighted least-squares fitting
LSQUnivariateSpline
a spline for which knots are user-selected
SmoothBivariateSpline
a smoothing bivariate spline through the given points
UnivariateSpline
a smooth univariate spline to fit a given set of data points.
spalde
a function to evaluate all derivatives of a B-spline
splev
a function to evaluate a B-spline or its derivatives
splint
a function to evaluate the definite integral of a B-spline between two given points
splrep
a function to find the B-spline representation of a 1-D curve
sproot
a function to find the roots of a cubic B-spline
>>> import matplotlib.pyplot as plt
... from scipy.interpolate import InterpolatedUnivariateSpline
... rng = np.random.default_rng()
... x = np.linspace(-3, 3, 50)
... y = np.exp(-x**2) + 0.1 * rng.standard_normal(50)
... spl = InterpolatedUnivariateSpline(x, y)
... plt.plot(x, y, 'ro', ms=5)
... xs = np.linspace(-3, 3, 1000)
... plt.plot(xs, spl(xs), 'g', lw=3, alpha=0.7)
... plt.show()
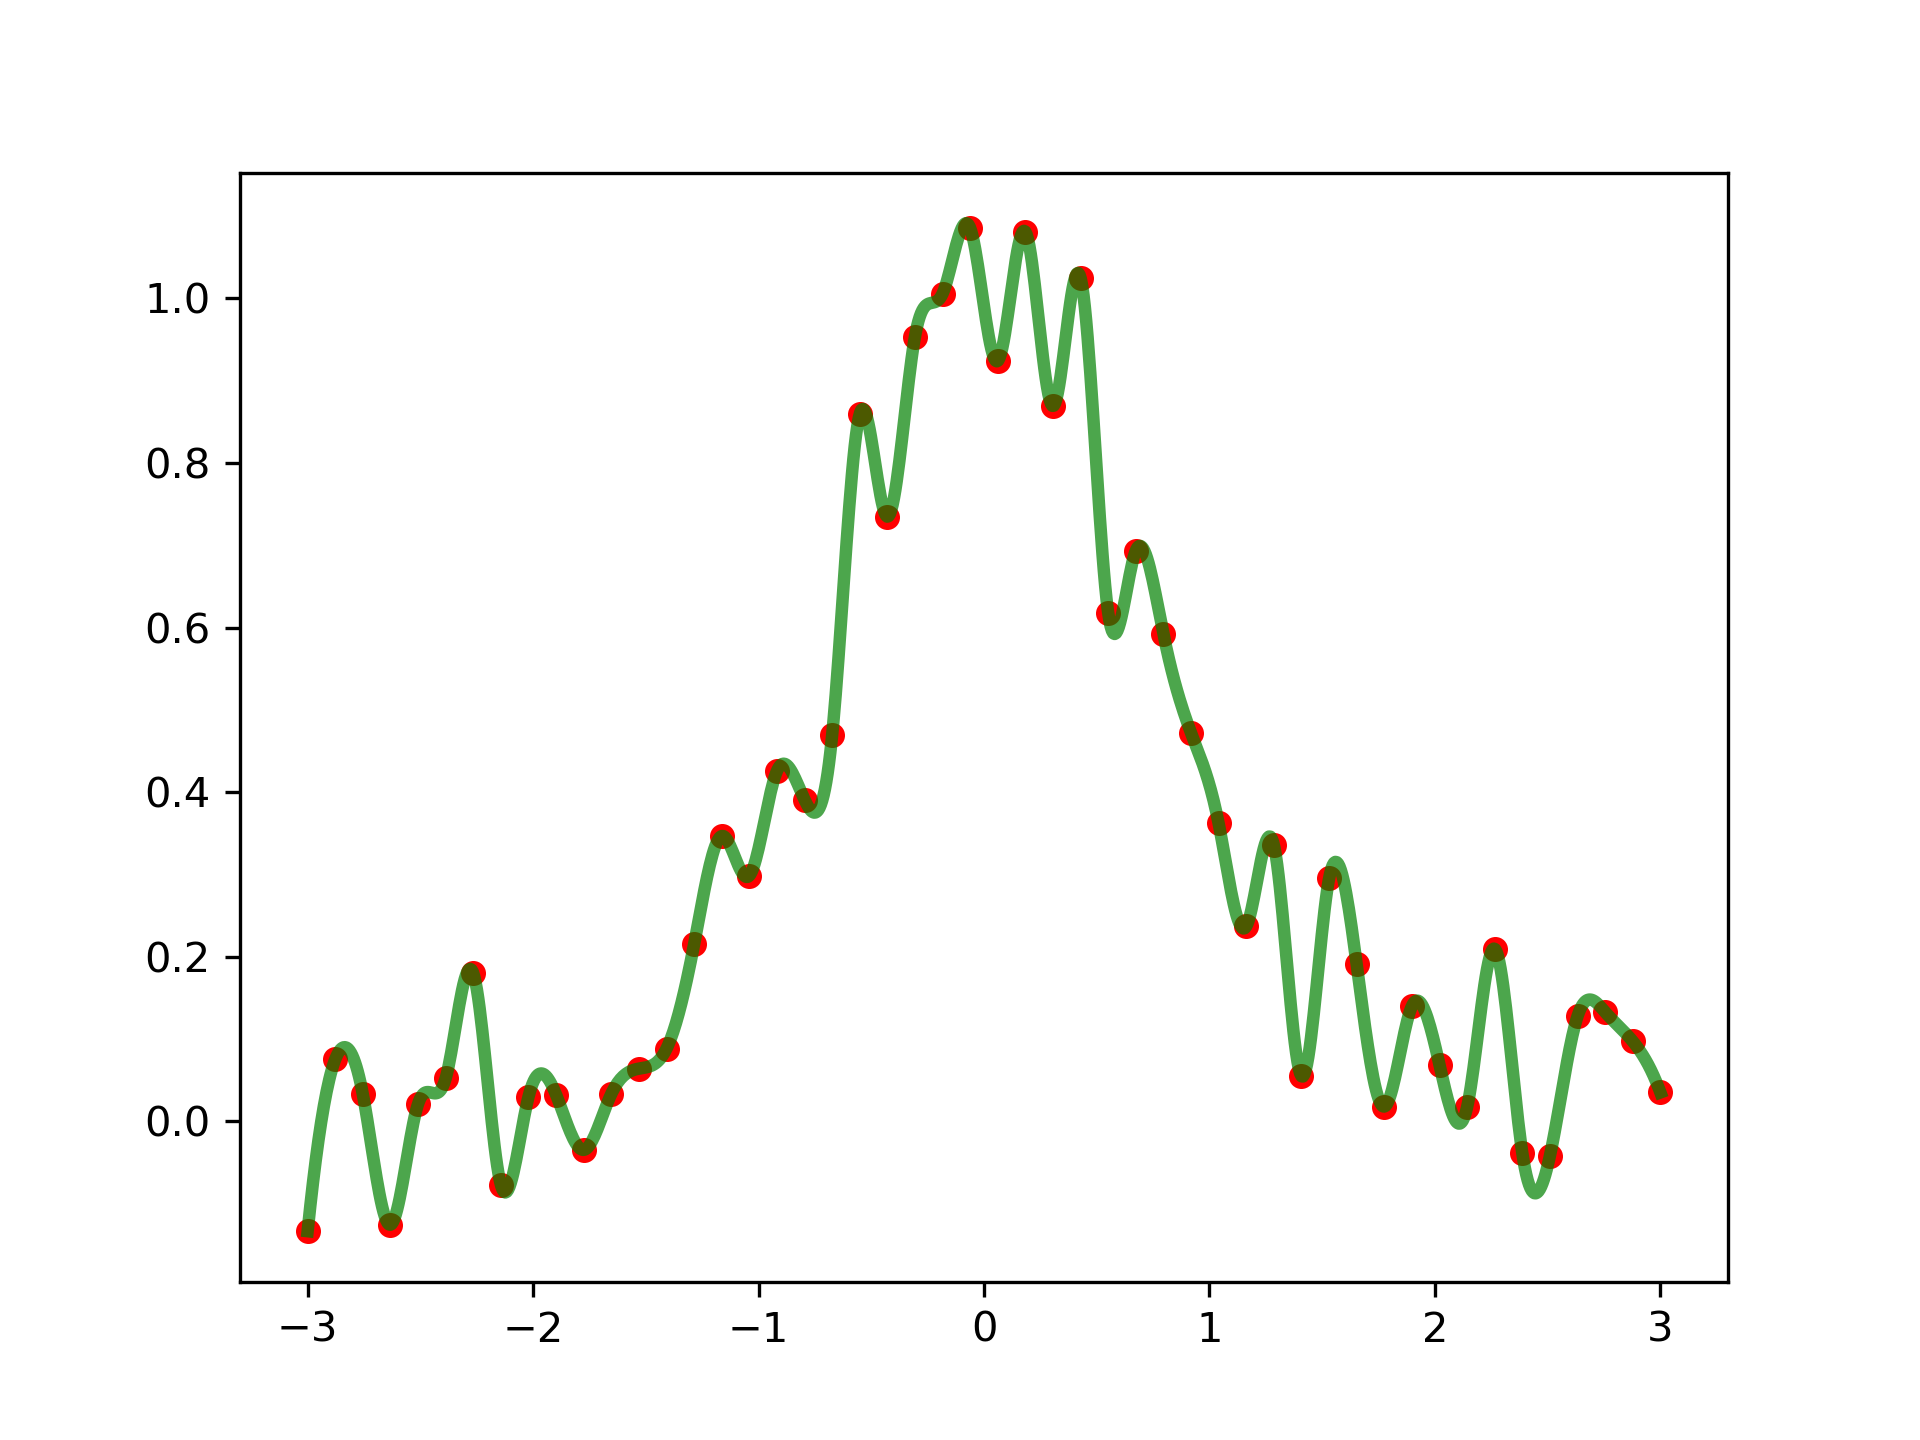
Notice that the spl(x)
interpolates y:
>>> spl.get_residual()
0.0
See :
The following pages refer to to this document either explicitly or contain code examples using this.
scipy.interpolate._fitpack2.InterpolatedUnivariateSpline
scipy.interpolate._fitpack2.LSQUnivariateSpline
scipy.interpolate._cubic.CubicSpline
scipy.interpolate._fitpack2.UnivariateSpline
Hover to see nodes names; edges to Self not shown, Caped at 50 nodes.
Using a canvas is more power efficient and can get hundred of nodes ; but does not allow hyperlinks; , arrows or text (beyond on hover)
SVG is more flexible but power hungry; and does not scale well to 50 + nodes.
All aboves nodes referred to, (or are referred from) current nodes; Edges from Self to other have been omitted (or all nodes would be connected to the central node "self" which is not useful). Nodes are colored by the library they belong to, and scaled with the number of references pointing them