unit_impulse(shape, idx=None, dtype=<class 'float'>)
The 1D case is also known as the Kronecker delta.
Number of samples in the output (1-D), or a tuple that represents the shape of the output (N-D).
Index at which the value is 1. If None, defaults to the 0th element. If idx='mid'
, the impulse will be centered at shape // 2
in all dimensions. If an int, the impulse will be at idx
in all dimensions.
The desired data-type for the array, e.g., numpy.int8
. Default is numpy.float64
.
Output array containing an impulse signal.
Unit impulse signal (discrete delta function) or unit basis vector.
An impulse at the 0th element ( $\delta[n]$ ):
>>> from scipy import signal
... signal.unit_impulse(8)
array([ 1.,  0.,  0.,  0.,  0.,  0.,  0.,  0.])
Impulse offset by 2 samples ( $\delta[n-2]$ ):
>>> signal.unit_impulse(7, 2)
array([ 0.,  0.,  1.,  0.,  0.,  0.,  0.])
2-dimensional impulse, centered:
>>> signal.unit_impulse((3, 3), 'mid')
array([[ 0.,  0.,  0.],
       [ 0.,  1.,  0.],
       [ 0.,  0.,  0.]])
Impulse at (2, 2), using broadcasting:
>>> signal.unit_impulse((4, 4), 2)
array([[ 0.,  0.,  0.,  0.],
       [ 0.,  0.,  0.,  0.],
       [ 0.,  0.,  1.,  0.],
       [ 0.,  0.,  0.,  0.]])
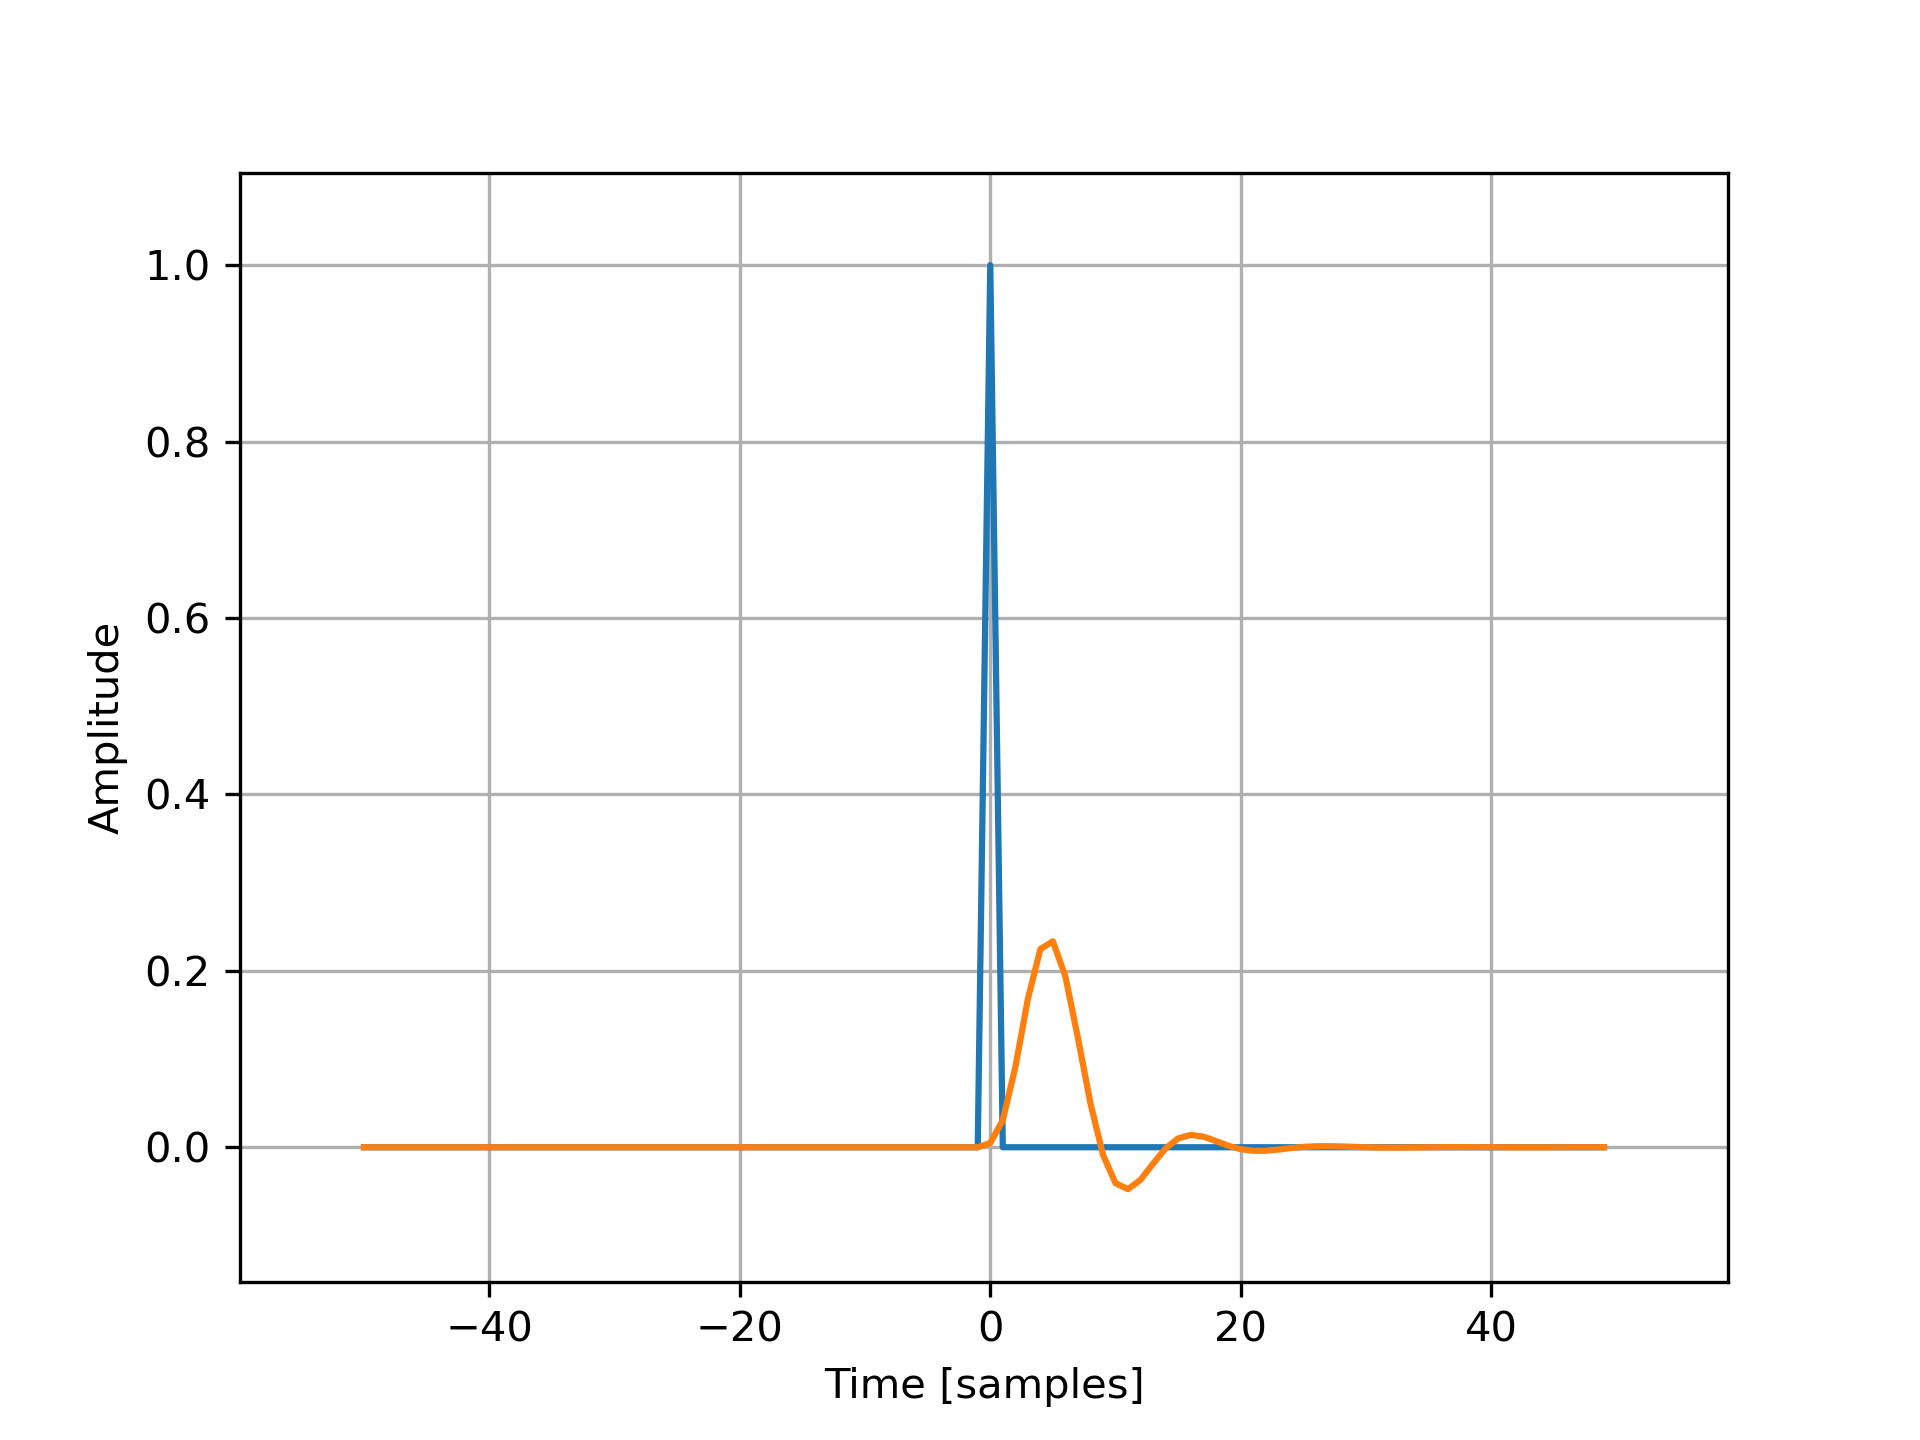
Plot the impulse response of a 4th-order Butterworth lowpass filter:
>>> imp = signal.unit_impulse(100, 'mid')
... b, a = signal.butter(4, 0.2)
... response = signal.lfilter(b, a, imp)
>>> import matplotlib.pyplot as plt
... plt.plot(np.arange(-50, 50), imp)
... plt.plot(np.arange(-50, 50), response)
... plt.margins(0.1, 0.1)
... plt.xlabel('Time [samples]')
... plt.ylabel('Amplitude')
... plt.grid(True)
... plt.show()
The following pages refer to to this document either explicitly or contain code examples using this.
scipy.signal._signaltools.sosfilt
scipy.signal._waveforms.unit_impulse
Hover to see nodes names; edges to Self not shown, Caped at 50 nodes.
Using a canvas is more power efficient and can get hundred of nodes ; but does not allow hyperlinks; , arrows or text (beyond on hover)
SVG is more flexible but power hungry; and does not scale well to 50 + nodes.
All aboves nodes referred to, (or are referred from) current nodes; Edges from Self to other have been omitted (or all nodes would be connected to the central node "self" which is not useful). Nodes are colored by the library they belong to, and scaled with the number of references pointing them