stft(x, fs=1.0, window='hann', nperseg=256, noverlap=None, nfft=None, detrend=False, return_onesided=True, boundary='zeros', padded=True, axis=-1)
STFTs can be used as a way of quantifying the change of a nonstationary signal's frequency and phase content over time.
In order to enable inversion of an STFT via the inverse STFT in istft
, the signal windowing must obey the constraint of "Nonzero OverLap Add" (NOLA), and the input signal must have complete windowing coverage (i.e. (x.shape[axis] - nperseg) %
(nperseg-noverlap) == 0
). The :None:None:`padded` argument may be used to accomplish this.
Given a time-domain signal $x[n]$
, a window $w[n]$
, and a hop size $H$
= :None:None:`nperseg - noverlap`, the windowed frame at time index $t$
is given by
The overlap-add (OLA) reconstruction equation is given by
$$x[n]=\frac{\sum_{t}x_{t}[n]w[n-tH]}{\sum_{t}w^{2}[n-tH]}$$The NOLA constraint ensures that every normalization term that appears in the denomimator of the OLA reconstruction equation is nonzero. Whether a choice of :None:None:`window`, :None:None:`nperseg`, and :None:None:`noverlap` satisfy this constraint can be tested with check_NOLA
.
Time series of measurement values
Sampling frequency of the x time series. Defaults to 1.0.
Desired window to use. If :None:None:`window` is a string or tuple, it is passed to get_window
to generate the window values, which are DFT-even by default. See get_window
for a list of windows and required parameters. If :None:None:`window` is array_like it will be used directly as the window and its length must be nperseg. Defaults to a Hann window.
Length of each segment. Defaults to 256.
Number of points to overlap between segments. If :None:None:`None`, noverlap = nperseg // 2
. Defaults to :None:None:`None`. When specified, the COLA constraint must be met (see Notes below).
Length of the FFT used, if a zero padded FFT is desired. If :None:None:`None`, the FFT length is :None:None:`nperseg`. Defaults to :None:None:`None`.
Specifies how to detrend each segment. If detrend
is a string, it is passed as the :None:None:`type` argument to the detrend
function. If it is a function, it takes a segment and returns a detrended segment. If detrend
is :None:None:`False`, no detrending is done. Defaults to :None:None:`False`.
If :None:None:`True`, return a one-sided spectrum for real data. If :None:None:`False` return a two-sided spectrum. Defaults to :None:None:`True`, but for complex data, a two-sided spectrum is always returned.
Specifies whether the input signal is extended at both ends, and how to generate the new values, in order to center the first windowed segment on the first input point. This has the benefit of enabling reconstruction of the first input point when the employed window function starts at zero. Valid options are ['even', 'odd', 'constant', 'zeros', None]
. Defaults to 'zeros', for zero padding extension. I.e. [1, 2, 3, 4]
is extended to [0, 1, 2, 3, 4, 0]
for nperseg=3
.
Specifies whether the input signal is zero-padded at the end to make the signal fit exactly into an integer number of window segments, so that all of the signal is included in the output. Defaults to :None:None:`True`. Padding occurs after boundary extension, if boundary
is not :None:None:`None`, and :None:None:`padded` is :None:None:`True`, as is the default.
Axis along which the STFT is computed; the default is over the last axis (i.e. axis=-1
).
Array of sample frequencies.
Array of segment times.
STFT of x. By default, the last axis of :None:None:`Zxx` corresponds to the segment times.
Compute the Short Time Fourier Transform (STFT).
check_COLA
Check whether the Constant OverLap Add (COLA) constraint is met
check_NOLA
Check whether the Nonzero Overlap Add (NOLA) constraint is met
csd
Cross spectral density by Welch's method.
istft
Inverse Short Time Fourier Transform
lombscargle
Lomb-Scargle periodogram for unevenly sampled data
spectrogram
Spectrogram by Welch's method.
welch
Power spectral density by Welch's method.
>>> from scipy import signal
... import matplotlib.pyplot as plt
... rng = np.random.default_rng()
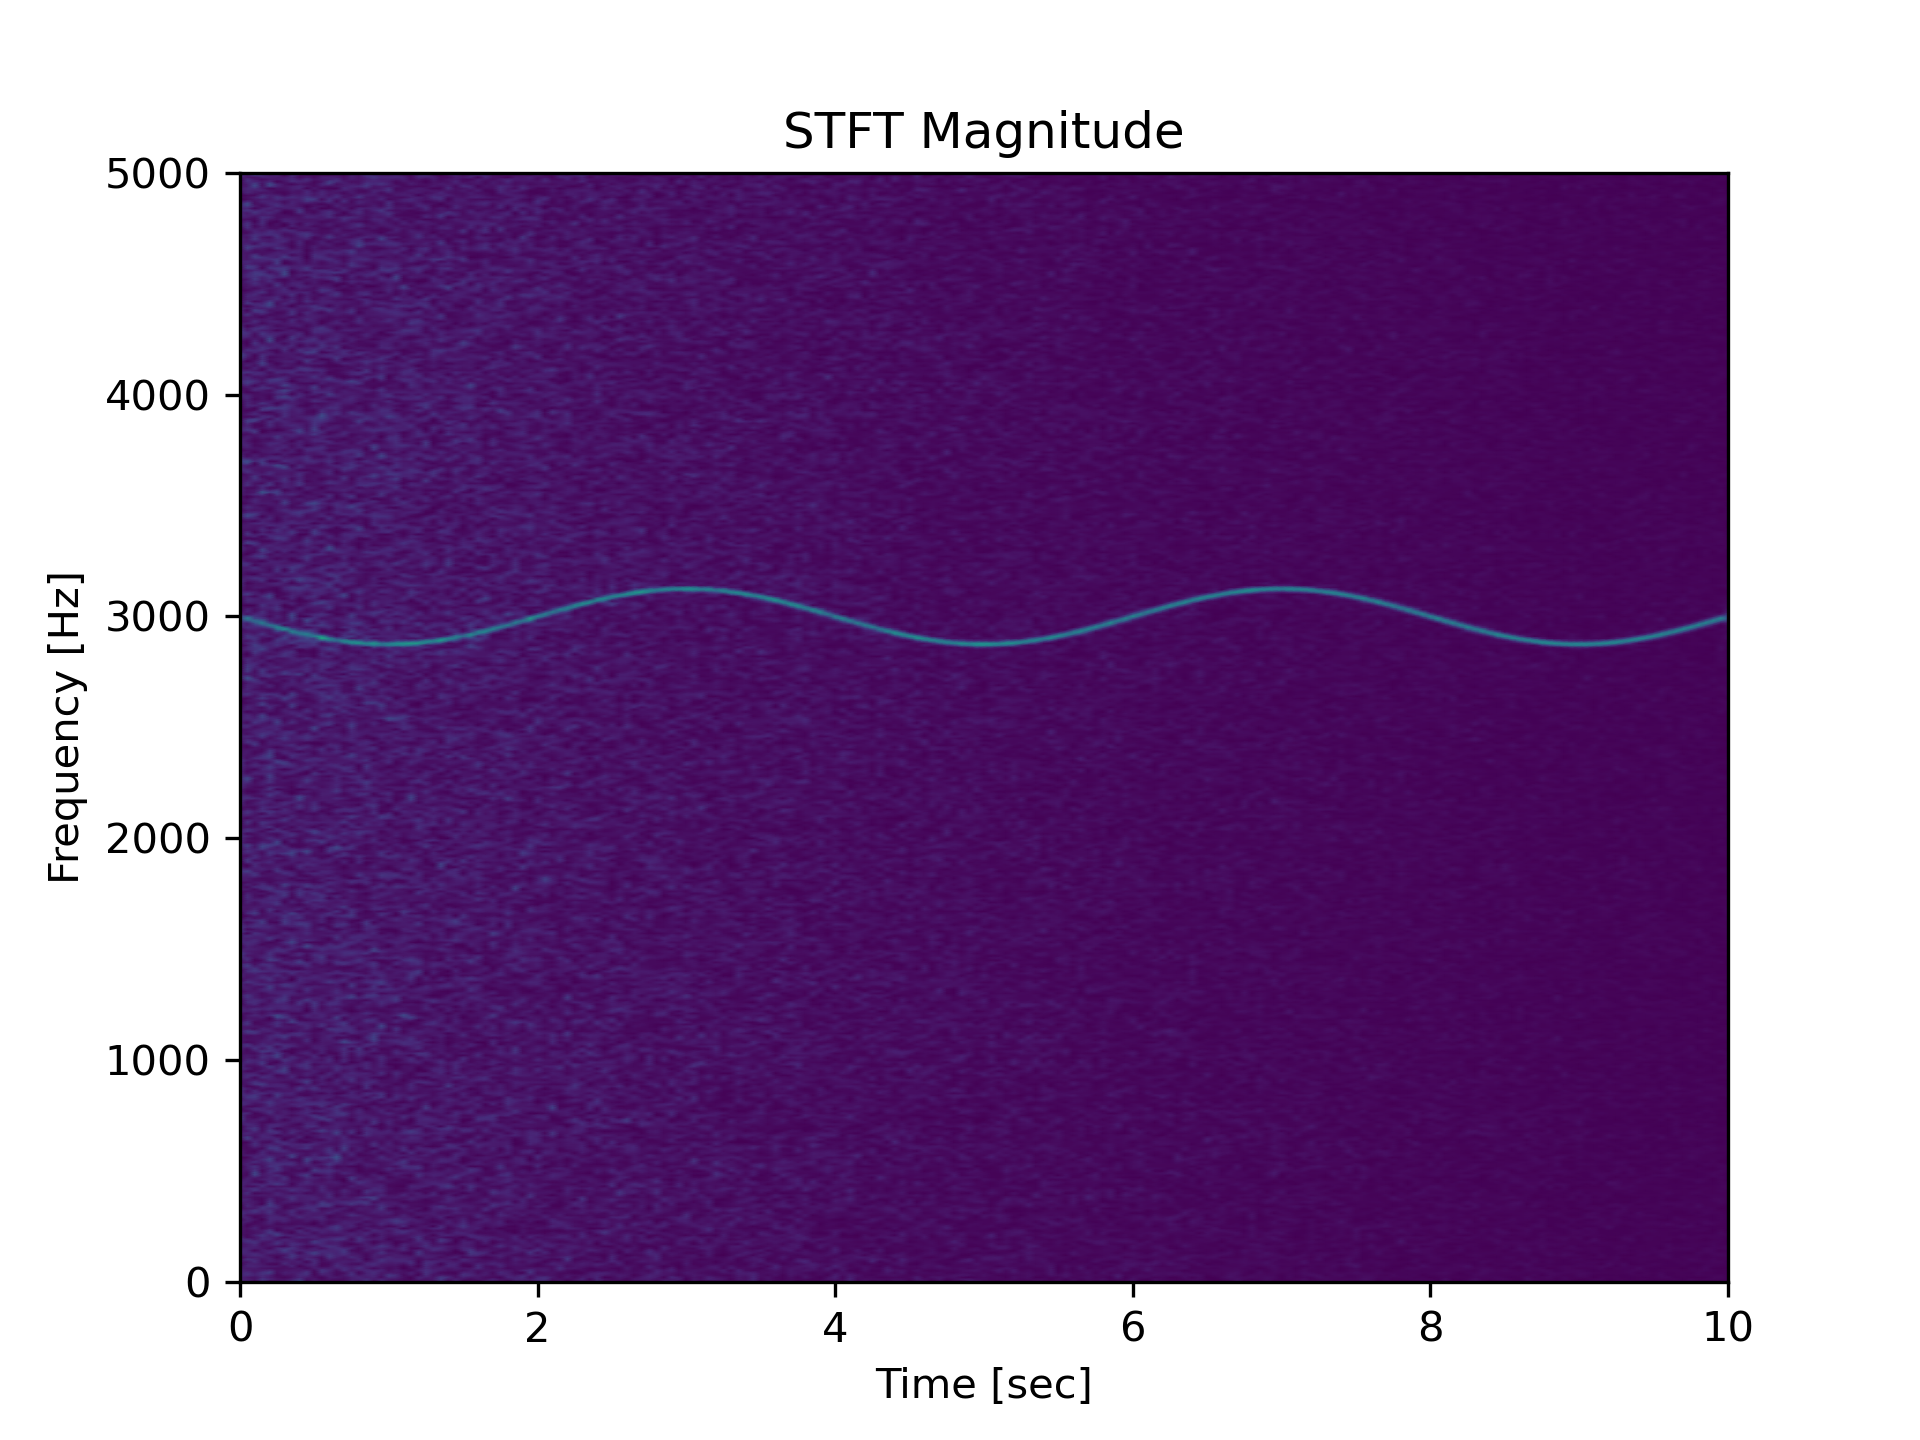
Generate a test signal, a 2 Vrms sine wave whose frequency is slowly modulated around 3kHz, corrupted by white noise of exponentially decreasing magnitude sampled at 10 kHz.
>>> fs = 10e3
... N = 1e5
... amp = 2 * np.sqrt(2)
... noise_power = 0.01 * fs / 2
... time = np.arange(N) / float(fs)
... mod = 500*np.cos(2*np.pi*0.25*time)
... carrier = amp * np.sin(2*np.pi*3e3*time + mod)
... noise = rng.normal(scale=np.sqrt(noise_power),
...                    size=time.shape)
... noise *= np.exp(-time/5)
... x = carrier + noise
Compute and plot the STFT's magnitude.
>>> f, t, Zxx = signal.stft(x, fs, nperseg=1000)
... plt.pcolormesh(t, f, np.abs(Zxx), vmin=0, vmax=amp, shading='gouraud')
... plt.title('STFT Magnitude')
... plt.ylabel('Frequency [Hz]')
... plt.xlabel('Time [sec]')
... plt.show()
The following pages refer to to this document either explicitly or contain code examples using this.
scipy.signal._spectral_py.check_NOLA
scipy.signal._spectral_py.stft
scipy.signal._spectral_py.check_COLA
scipy.signal._spectral_py.spectrogram
scipy.signal._spectral_py.istft
Hover to see nodes names; edges to Self not shown, Caped at 50 nodes.
Using a canvas is more power efficient and can get hundred of nodes ; but does not allow hyperlinks; , arrows or text (beyond on hover)
SVG is more flexible but power hungry; and does not scale well to 50 + nodes.
All aboves nodes referred to, (or are referred from) current nodes; Edges from Self to other have been omitted (or all nodes would be connected to the central node "self" which is not useful). Nodes are colored by the library they belong to, and scaled with the number of references pointing them