istft(Zxx, fs=1.0, window='hann', nperseg=None, noverlap=None, nfft=None, input_onesided=True, boundary=True, time_axis=-1, freq_axis=-2)
In order to enable inversion of an STFT via the inverse STFT with istft
, the signal windowing must obey the constraint of "nonzero overlap add" (NOLA):
This ensures that the normalization factors that appear in the denominator of the overlap-add reconstruction equation
$$x[n]=\frac{\sum_{t}x_{t}[n]w[n-tH]}{\sum_{t}w^{2}[n-tH]}$$are not zero. The NOLA constraint can be checked with the check_NOLA
function.
An STFT which has been modified (via masking or otherwise) is not guaranteed to correspond to a exactly realizible signal. This function implements the iSTFT via the least-squares estimation algorithm detailed in , which produces a signal that minimizes the mean squared error between the STFT of the returned signal and the modified STFT.
STFT of the signal to be reconstructed. If a purely real array is passed, it will be cast to a complex data type.
Sampling frequency of the time series. Defaults to 1.0.
Desired window to use. If :None:None:`window` is a string or tuple, it is passed to get_window
to generate the window values, which are DFT-even by default. See get_window
for a list of windows and required parameters. If :None:None:`window` is array_like it will be used directly as the window and its length must be nperseg. Defaults to a Hann window. Must match the window used to generate the STFT for faithful inversion.
Number of data points corresponding to each STFT segment. This parameter must be specified if the number of data points per segment is odd, or if the STFT was padded via nfft >
nperseg
. If :None:None:`None`, the value depends on the shape of :None:None:`Zxx` and :None:None:`input_onesided`. If :None:None:`input_onesided` is :None:None:`True`, nperseg=2*(Zxx.shape[freq_axis] - 1)
. Otherwise, nperseg=Zxx.shape[freq_axis]
. Defaults to :None:None:`None`.
Number of points to overlap between segments. If :None:None:`None`, half of the segment length. Defaults to :None:None:`None`. When specified, the COLA constraint must be met (see Notes below), and should match the parameter used to generate the STFT. Defaults to :None:None:`None`.
Number of FFT points corresponding to each STFT segment. This parameter must be specified if the STFT was padded via nfft >
nperseg
. If :None:None:`None`, the default values are the same as for :None:None:`nperseg`, detailed above, with one exception: if :None:None:`input_onesided` is True and nperseg==2*Zxx.shape[freq_axis] - 1
, :None:None:`nfft` also takes on that value. This case allows the proper inversion of an odd-length unpadded STFT using nfft=None
. Defaults to :None:None:`None`.
If :None:None:`True`, interpret the input array as one-sided FFTs, such as is returned by stft
with return_onesided=True
and numpy.fft.rfft
. If :None:None:`False`, interpret the input as a a two-sided FFT. Defaults to :None:None:`True`.
Specifies whether the input signal was extended at its boundaries by supplying a non-:None:None:`None` boundary
argument to stft
. Defaults to :None:None:`True`.
Where the time segments of the STFT is located; the default is the last axis (i.e. axis=-1
).
Where the frequency axis of the STFT is located; the default is the penultimate axis (i.e. axis=-2
).
Perform the inverse Short Time Fourier transform (iSTFT).
check_COLA
Check whether the Constant OverLap Add (COLA) constraint is met
check_NOLA
Check whether the Nonzero Overlap Add (NOLA) constraint is met
stft
Short Time Fourier Transform
>>> from scipy import signal
... import matplotlib.pyplot as plt
... rng = np.random.default_rng()
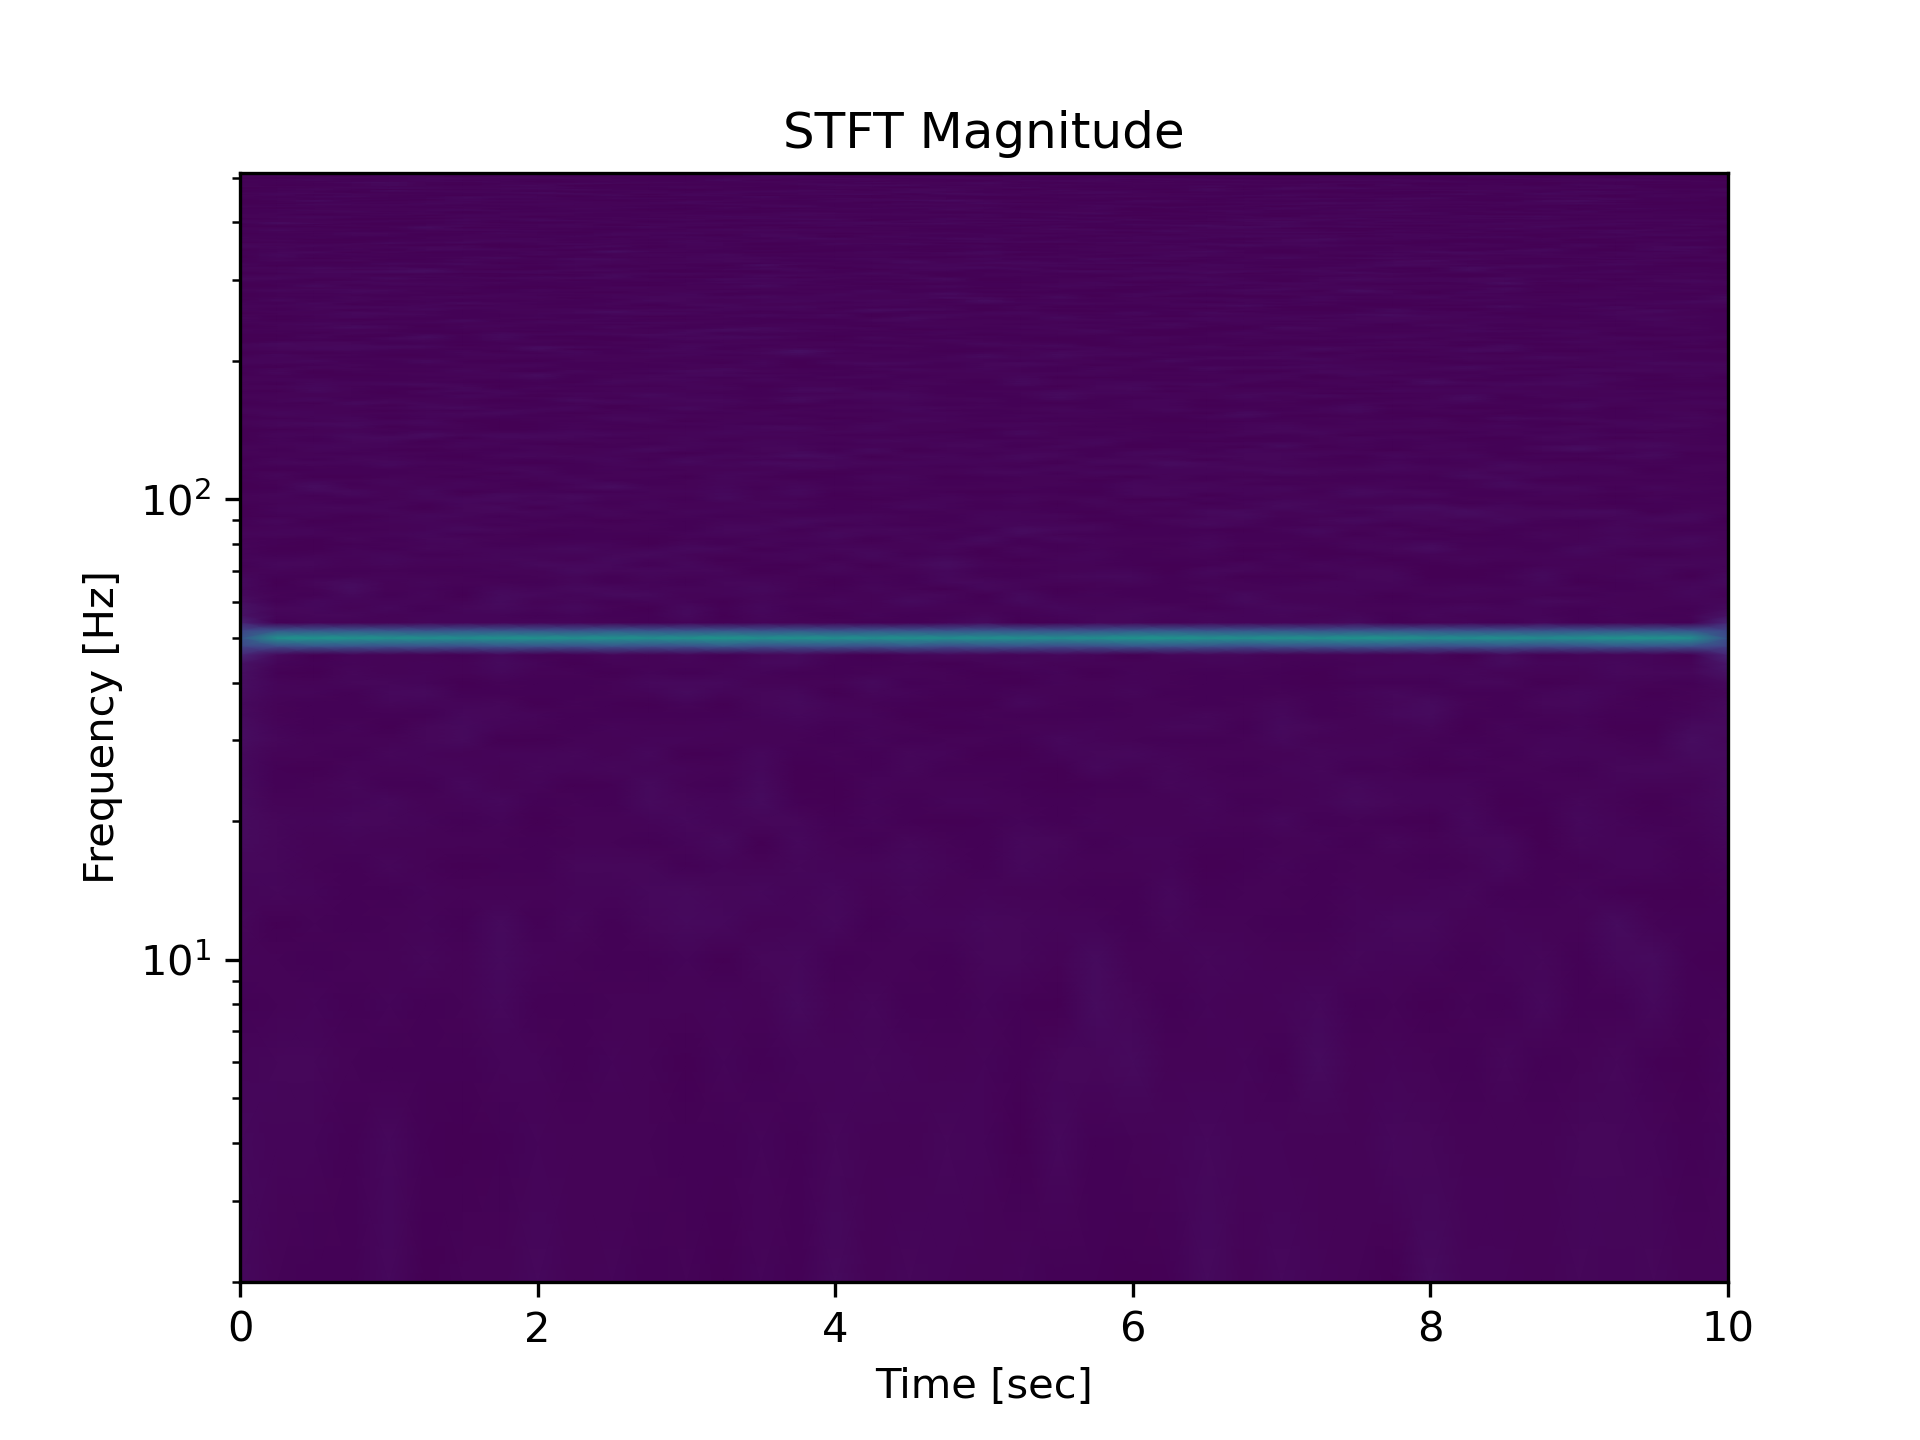
Generate a test signal, a 2 Vrms sine wave at 50Hz corrupted by 0.001 V**2/Hz of white noise sampled at 1024 Hz.
>>> fs = 1024
... N = 10*fs
... nperseg = 512
... amp = 2 * np.sqrt(2)
... noise_power = 0.001 * fs / 2
... time = np.arange(N) / float(fs)
... carrier = amp * np.sin(2*np.pi*50*time)
... noise = rng.normal(scale=np.sqrt(noise_power),
...                    size=time.shape)
... x = carrier + noise
Compute the STFT, and plot its magnitude
>>> f, t, Zxx = signal.stft(x, fs=fs, nperseg=nperseg)
... plt.figure()
... plt.pcolormesh(t, f, np.abs(Zxx), vmin=0, vmax=amp, shading='gouraud')
... plt.ylim([f[1], f[-1]])
... plt.title('STFT Magnitude')
... plt.ylabel('Frequency [Hz]')
... plt.xlabel('Time [sec]')
... plt.yscale('log')
... plt.show()
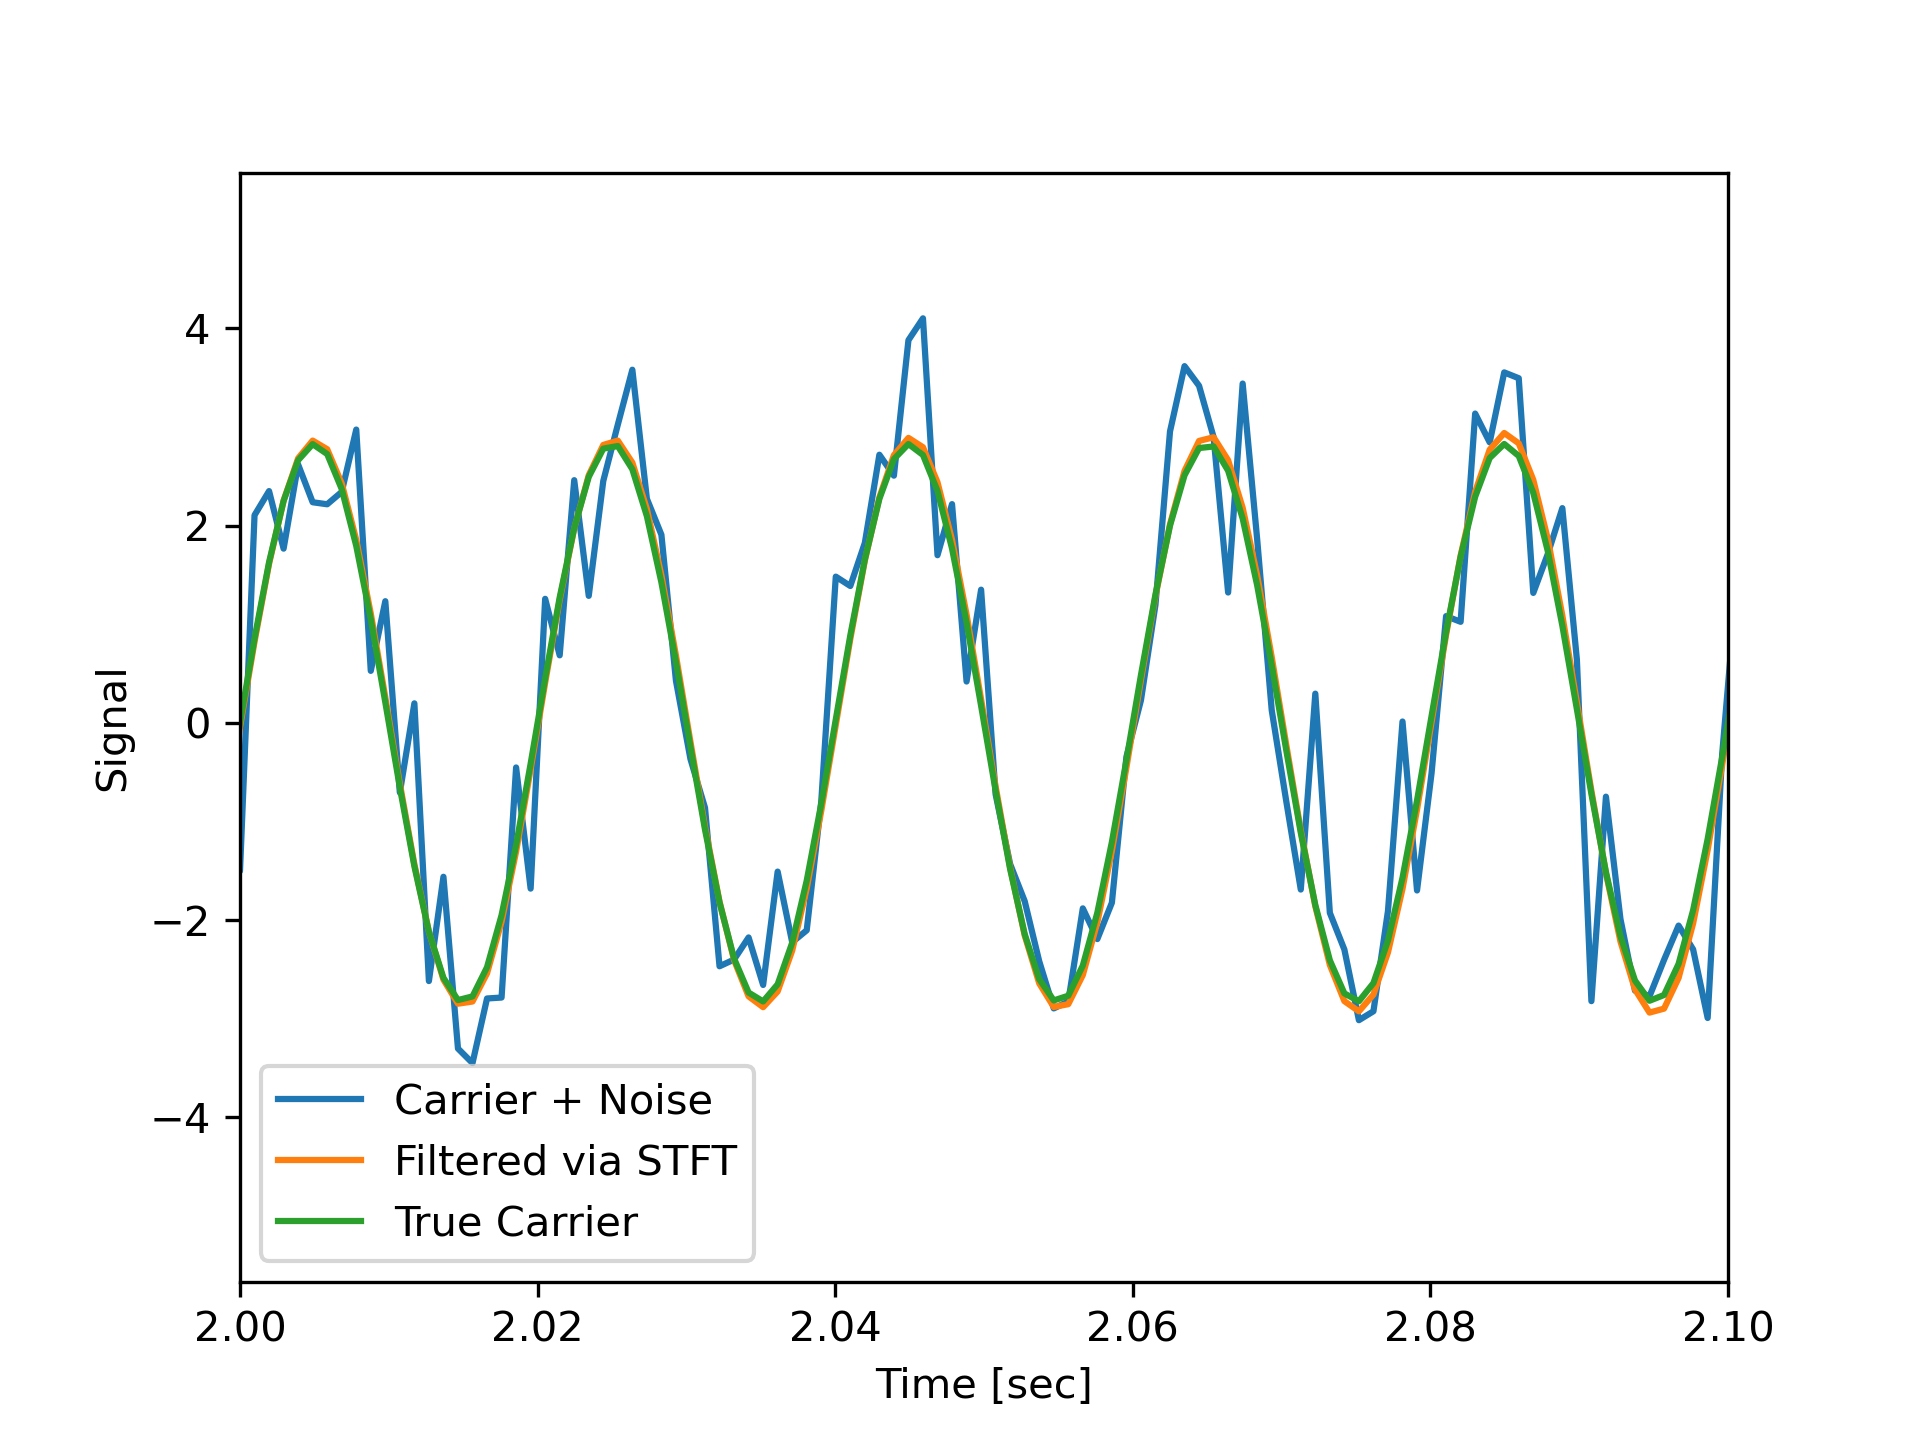
Zero the components that are 10% or less of the carrier magnitude, then convert back to a time series via inverse STFT
>>> Zxx = np.where(np.abs(Zxx) >= amp/10, Zxx, 0)
... _, xrec = signal.istft(Zxx, fs)
Compare the cleaned signal with the original and true carrier signals.
>>> plt.figure()
... plt.plot(time, x, time, xrec, time, carrier)
... plt.xlim([2, 2.1])
... plt.xlabel('Time [sec]')
... plt.ylabel('Signal')
... plt.legend(['Carrier + Noise', 'Filtered via STFT', 'True Carrier'])
... plt.show()
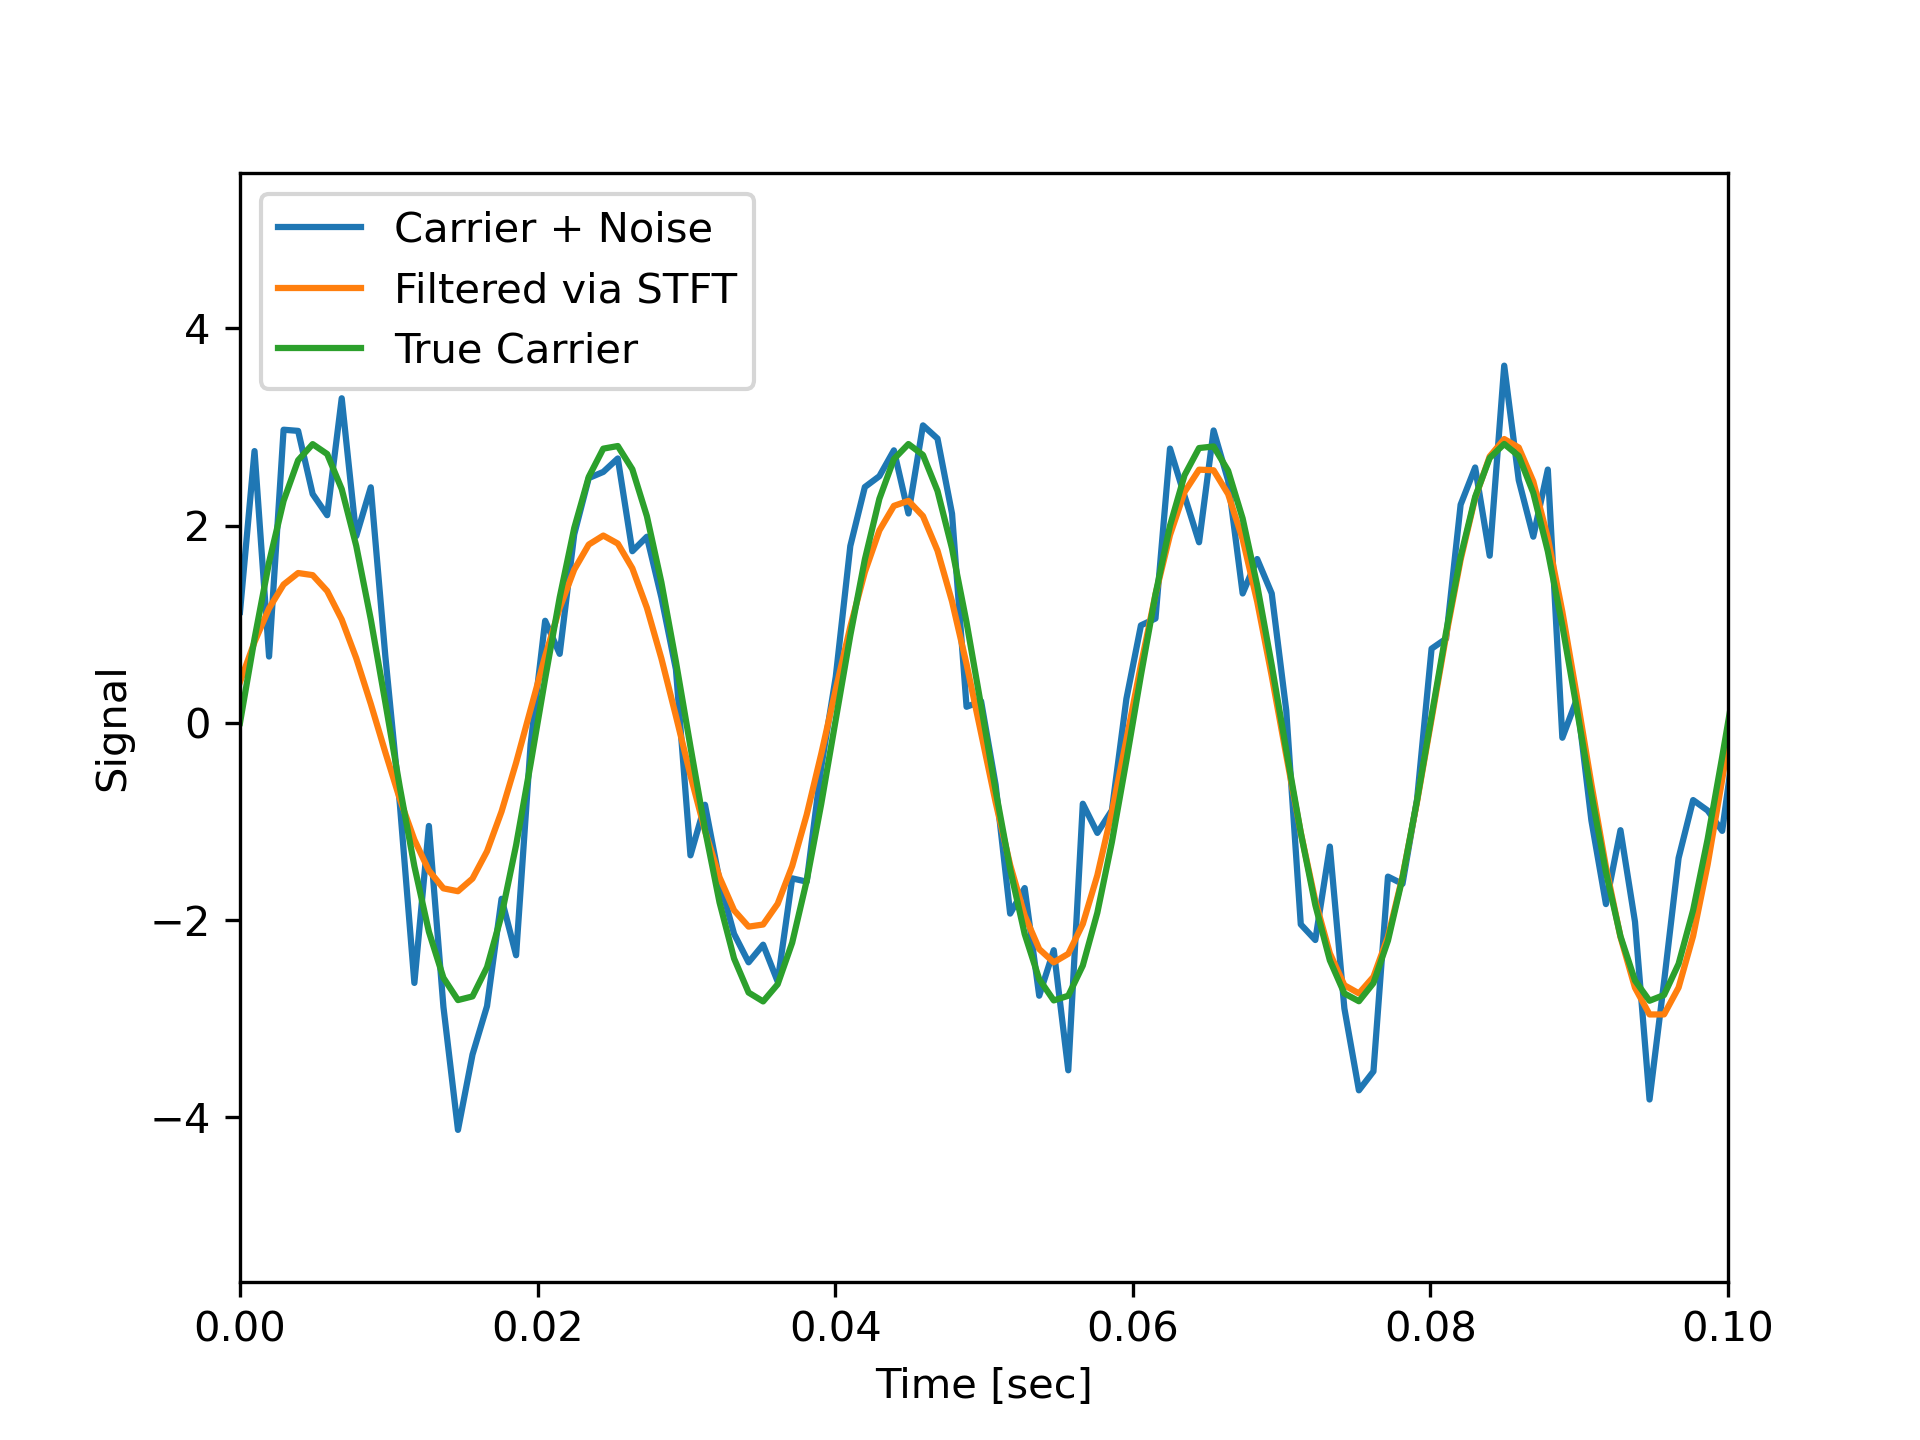
Note that the cleaned signal does not start as abruptly as the original, since some of the coefficients of the transient were also removed:
>>> plt.figure()
... plt.plot(time, x, time, xrec, time, carrier)
... plt.xlim([0, 0.1])
... plt.xlabel('Time [sec]')
... plt.ylabel('Signal')
... plt.legend(['Carrier + Noise', 'Filtered via STFT', 'True Carrier'])
... plt.show()
The following pages refer to to this document either explicitly or contain code examples using this.
scipy.signal._spectral_py.check_NOLA
scipy.signal._spectral_py.stft
scipy.signal._spectral_py.check_COLA
scipy.signal._spectral_py.lombscargle
scipy.signal._spectral_py.istft
Hover to see nodes names; edges to Self not shown, Caped at 50 nodes.
Using a canvas is more power efficient and can get hundred of nodes ; but does not allow hyperlinks; , arrows or text (beyond on hover)
SVG is more flexible but power hungry; and does not scale well to 50 + nodes.
All aboves nodes referred to, (or are referred from) current nodes; Edges from Self to other have been omitted (or all nodes would be connected to the central node "self" which is not useful). Nodes are colored by the library they belong to, and scaled with the number of references pointing them