iirnotch(w0, Q, fs=2.0)
A notch filter is a band-stop filter with a narrow bandwidth (high quality factor). It rejects a narrow frequency band and leaves the rest of the spectrum little changed.
Frequency to remove from a signal. If :None:None:`fs` is specified, this is in the same units as :None:None:`fs`. By default, it is a normalized scalar that must satisfy 0 < w0 < 1
, with w0 = 1
corresponding to half of the sampling frequency.
Quality factor. Dimensionless parameter that characterizes notch filter -3 dB bandwidth bw
relative to its center frequency, Q = w0/bw
.
The sampling frequency of the digital system.
Numerator ( b
) and denominator ( a
) polynomials of the IIR filter.
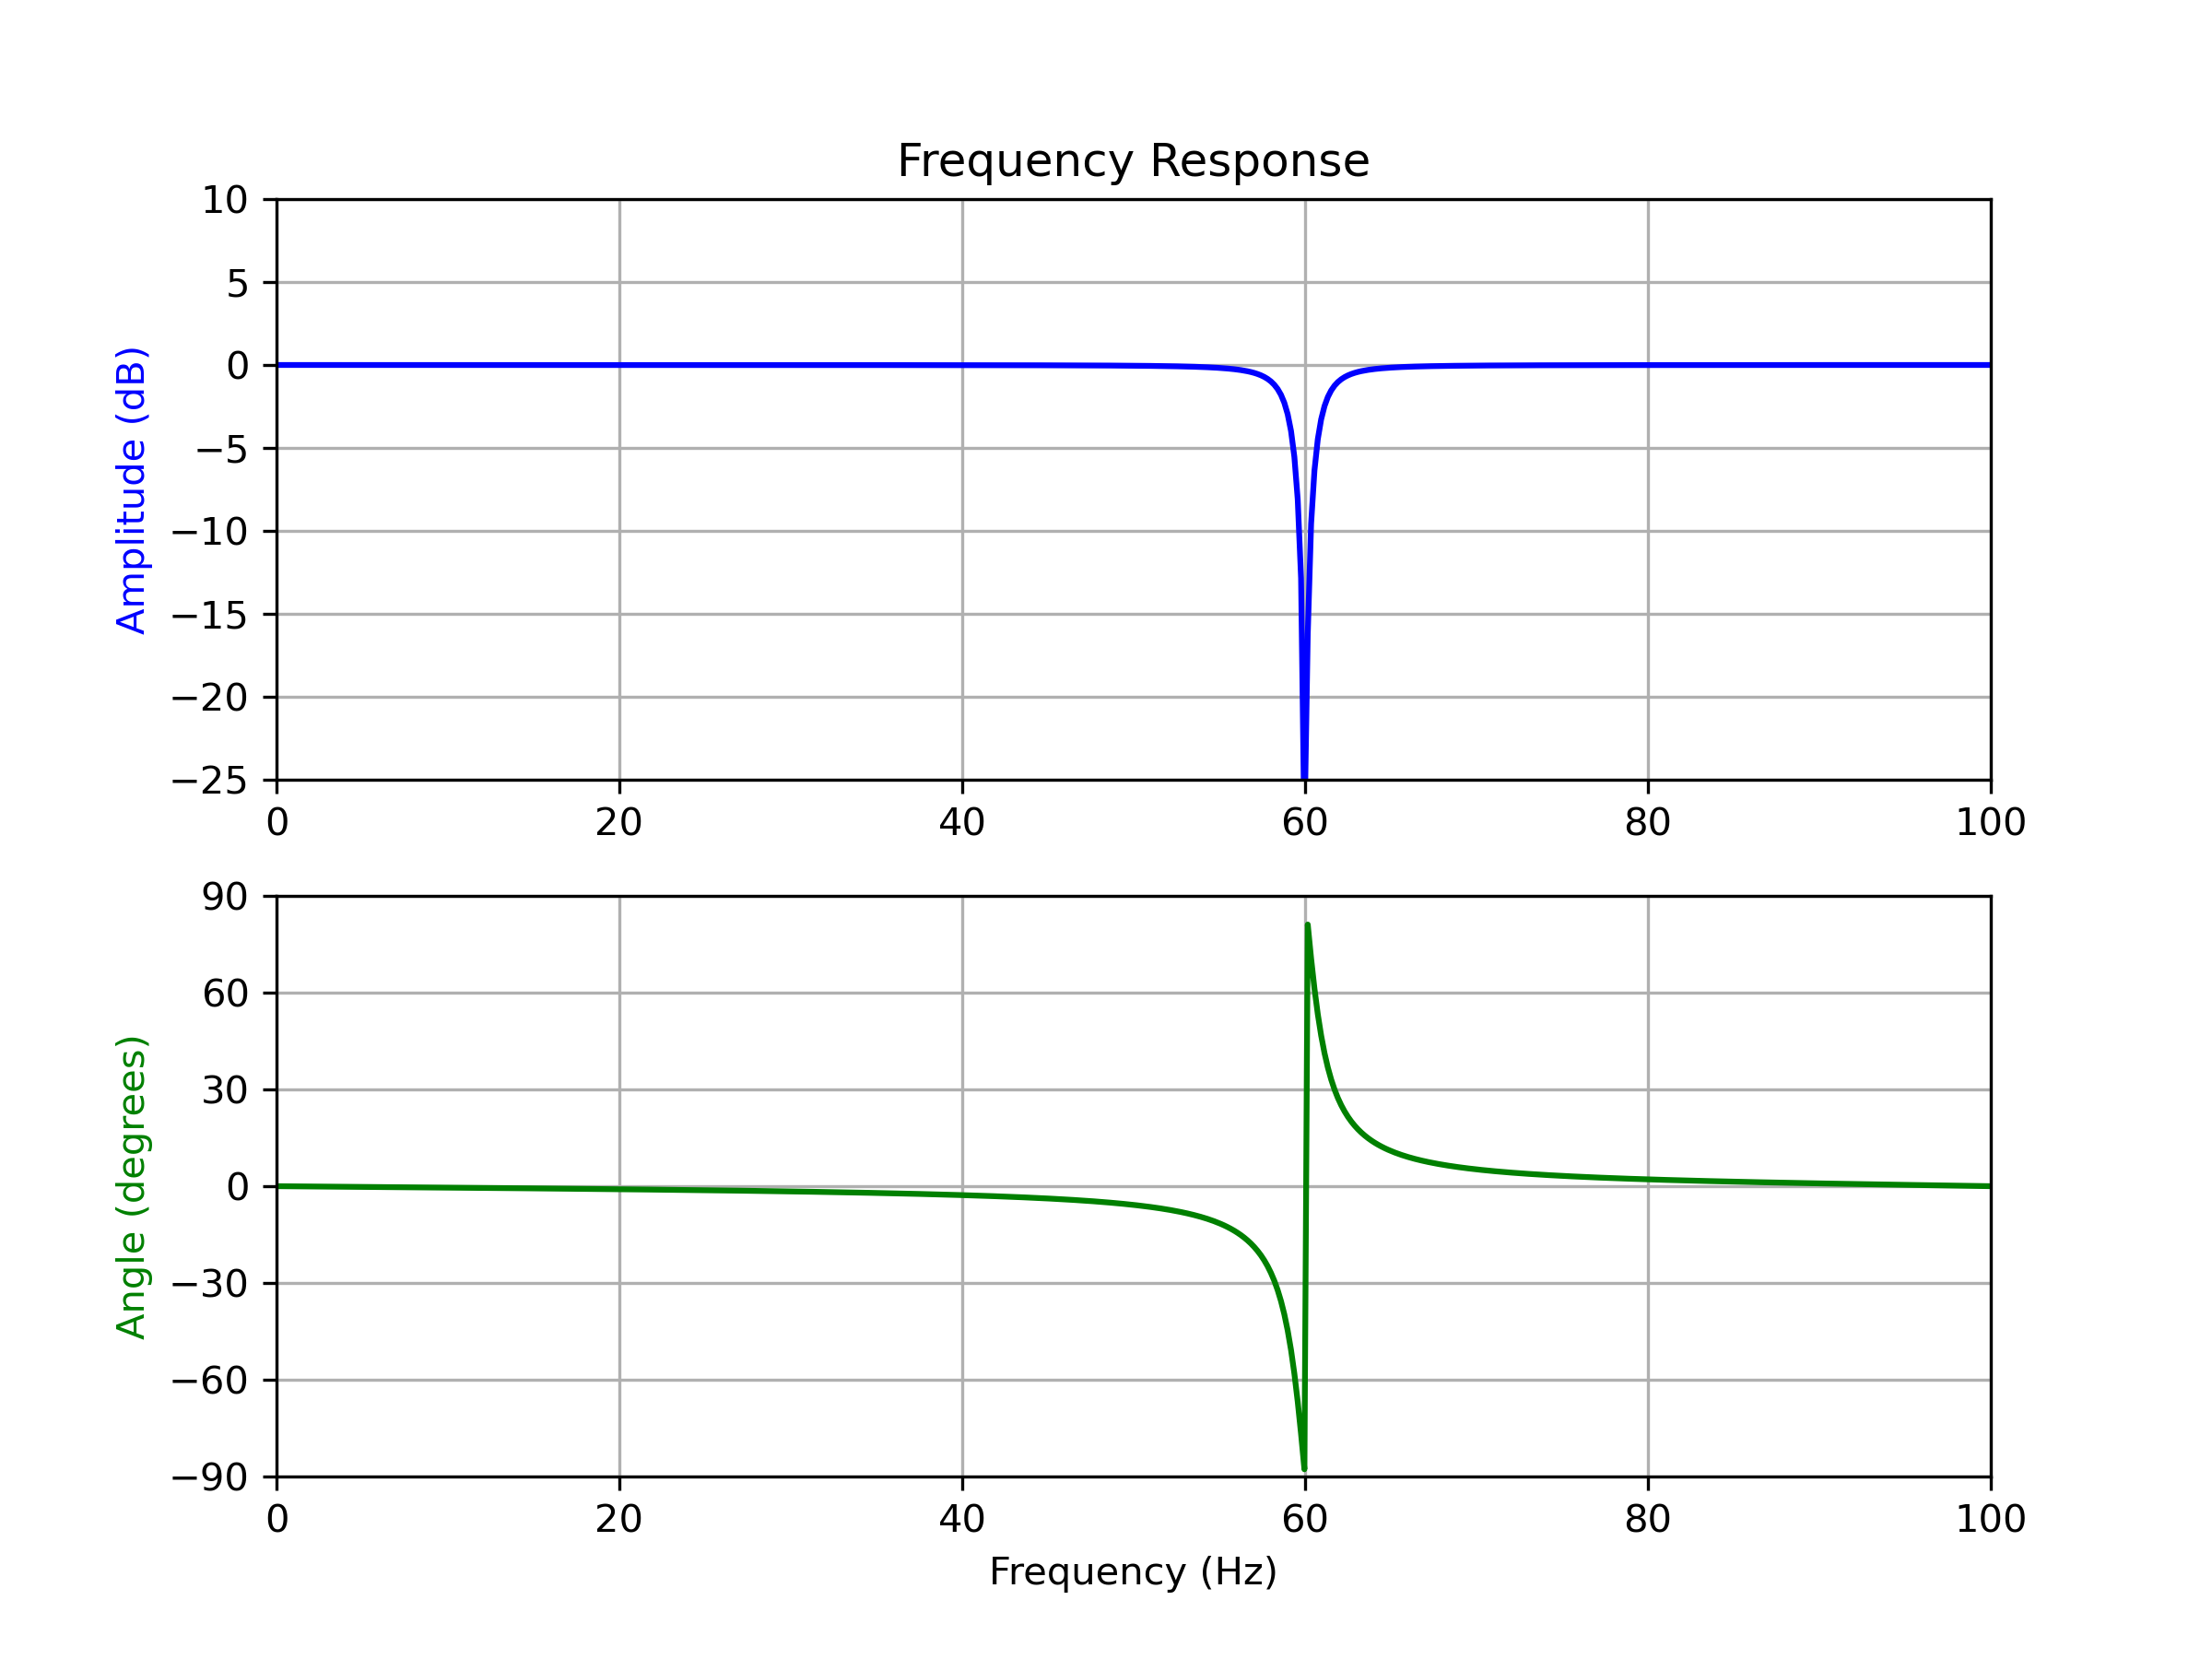
Design second-order IIR notch digital filter.
Design and plot filter to remove the 60 Hz component from a signal sampled at 200 Hz, using a quality factor Q = 30
>>> from scipy import signal
... import matplotlib.pyplot as plt
>>> fs = 200.0  # Sample frequency (Hz)
... f0 = 60.0  # Frequency to be removed from signal (Hz)
... Q = 30.0  # Quality factor
... # Design notch filter
... b, a = signal.iirnotch(f0, Q, fs)
>>> # Frequency response
... freq, h = signal.freqz(b, a, fs=fs)
... # Plot
... fig, ax = plt.subplots(2, 1, figsize=(8, 6))
... ax[0].plot(freq, 20*np.log10(abs(h)), color='blue')
... ax[0].set_title("Frequency Response")
... ax[0].set_ylabel("Amplitude (dB)", color='blue')
... ax[0].set_xlim([0, 100])
... ax[0].set_ylim([-25, 10])
... ax[0].grid()
... ax[1].plot(freq, np.unwrap(np.angle(h))*180/np.pi, color='green')
... ax[1].set_ylabel("Angle (degrees)", color='green')
... ax[1].set_xlabel("Frequency (Hz)")
... ax[1].set_xlim([0, 100])
... ax[1].set_yticks([-90, -60, -30, 0, 30, 60, 90])
... ax[1].set_ylim([-90, 90])
... ax[1].grid()
... plt.show()
The following pages refer to to this document either explicitly or contain code examples using this.
scipy.signal._filter_design.iirnotch
scipy.signal._filter_design.iircomb
scipy.signal._filter_design.iirpeak
Hover to see nodes names; edges to Self not shown, Caped at 50 nodes.
Using a canvas is more power efficient and can get hundred of nodes ; but does not allow hyperlinks; , arrows or text (beyond on hover)
SVG is more flexible but power hungry; and does not scale well to 50 + nodes.
All aboves nodes referred to, (or are referred from) current nodes; Edges from Self to other have been omitted (or all nodes would be connected to the central node "self" which is not useful). Nodes are colored by the library they belong to, and scaled with the number of references pointing them