find_peaks(x, height=None, threshold=None, distance=None, prominence=None, width=None, wlen=None, rel_height=0.5, plateau_size=None)
This function takes a 1-D array and finds all local maxima by simple comparison of neighboring values. Optionally, a subset of these peaks can be selected by specifying conditions for a peak's properties.
In the context of this function, a peak or local maximum is defined as any sample whose two direct neighbours have a smaller amplitude. For flat peaks (more than one sample of equal amplitude wide) the index of the middle sample is returned (rounded down in case the number of samples is even). For noisy signals the peak locations can be off because the noise might change the position of local maxima. In those cases consider smoothing the signal before searching for peaks or use other peak finding and fitting methods (like find_peaks_cwt
).
Some additional comments on specifying conditions:
Almost all conditions (excluding distance
) can be given as half-open or closed intervals, e.g., 1
or (1, None)
defines the half-open interval $[1, \infty]$
while (None, 1)
defines the interval $[-\infty, 1]$
. The open interval (None, None)
can be specified as well, which returns the matching properties without exclusion of peaks.
The border is always included in the interval used to select valid peaks.
For several conditions the interval borders can be specified with arrays matching x in shape which enables dynamic constrains based on the sample position.
The conditions are evaluated in the following order: :None:None:`plateau_size`, :None:None:`height`, threshold
, distance
, :None:None:`prominence`, :None:None:`width`. In most cases this order is the fastest one because faster operations are applied first to reduce the number of peaks that need to be evaluated later.
While indices in :None:None:`peaks` are guaranteed to be at least distance
samples apart, edges of flat peaks may be closer than the allowed distance
.
Use wlen
to reduce the time it takes to evaluate the conditions for :None:None:`prominence` or :None:None:`width` if x is large or has many local maxima (see peak_prominences
).
A signal with peaks.
Required height of peaks. Either a number, None
, an array matching x or a 2-element sequence of the former. The first element is always interpreted as the minimal and the second, if supplied, as the maximal required height.
Required threshold of peaks, the vertical distance to its neighboring samples. Either a number, None
, an array matching x or a 2-element sequence of the former. The first element is always interpreted as the minimal and the second, if supplied, as the maximal required threshold.
Required minimal horizontal distance (>= 1) in samples between neighbouring peaks. Smaller peaks are removed first until the condition is fulfilled for all remaining peaks.
Required prominence of peaks. Either a number, None
, an array matching x or a 2-element sequence of the former. The first element is always interpreted as the minimal and the second, if supplied, as the maximal required prominence.
Required width of peaks in samples. Either a number, None
, an array matching x or a 2-element sequence of the former. The first element is always interpreted as the minimal and the second, if supplied, as the maximal required width.
Used for calculation of the peaks prominences, thus it is only used if one of the arguments :None:None:`prominence` or :None:None:`width` is given. See argument wlen
in peak_prominences
for a full description of its effects.
Used for calculation of the peaks width, thus it is only used if :None:None:`width` is given. See argument :None:None:`rel_height` in peak_widths
for a full description of its effects.
Required size of the flat top of peaks in samples. Either a number, None
, an array matching x or a 2-element sequence of the former. The first element is always interpreted as the minimal and the second, if supplied as the maximal required plateau size.
Indices of peaks in x that satisfy all given conditions.
A dictionary containing properties of the returned peaks which were calculated as intermediate results during evaluation of the specified conditions:
'peak_heights'
If :None:None:`height` is given, the height of each peak in x.
'left_thresholds', 'right_thresholds'
If threshold
is given, these keys contain a peaks vertical distance to its neighbouring samples.
'prominences', 'right_bases', 'left_bases'
If :None:None:`prominence` is given, these keys are accessible. See peak_prominences
for a description of their content.
'width_heights', 'left_ips', 'right_ips'
If :None:None:`width` is given, these keys are accessible. See peak_widths
for a description of their content.
'plateau_sizes', left_edges', 'right_edges'
If :None:None:`plateau_size` is given, these keys are accessible and contain the indices of a peak's edges (edges are still part of the plateau) and the calculated plateau sizes.
To calculate and return properties without excluding peaks, provide the open interval (None, None)
as a value to the appropriate argument (excluding distance
).
Find peaks inside a signal based on peak properties.
Raised if a peak's properties have unexpected values (see peak_prominences
and peak_widths
).
find_peaks_cwt
Find peaks using the wavelet transformation.
peak_prominences
Directly calculate the prominence of peaks.
peak_widths
Directly calculate the width of peaks.
To demonstrate this function's usage we use a signal x supplied with SciPy (see scipy.misc.electrocardiogram
). Let's find all peaks (local maxima) in x whose amplitude lies above 0.
>>> import matplotlib.pyplot as plt
... from scipy.misc import electrocardiogram
... from scipy.signal import find_peaks
... x = electrocardiogram()[2000:4000]
... peaks, _ = find_peaks(x, height=0)
... plt.plot(x)
... plt.plot(peaks, x[peaks], "x")
... plt.plot(np.zeros_like(x), "--", color="gray")
... plt.show()
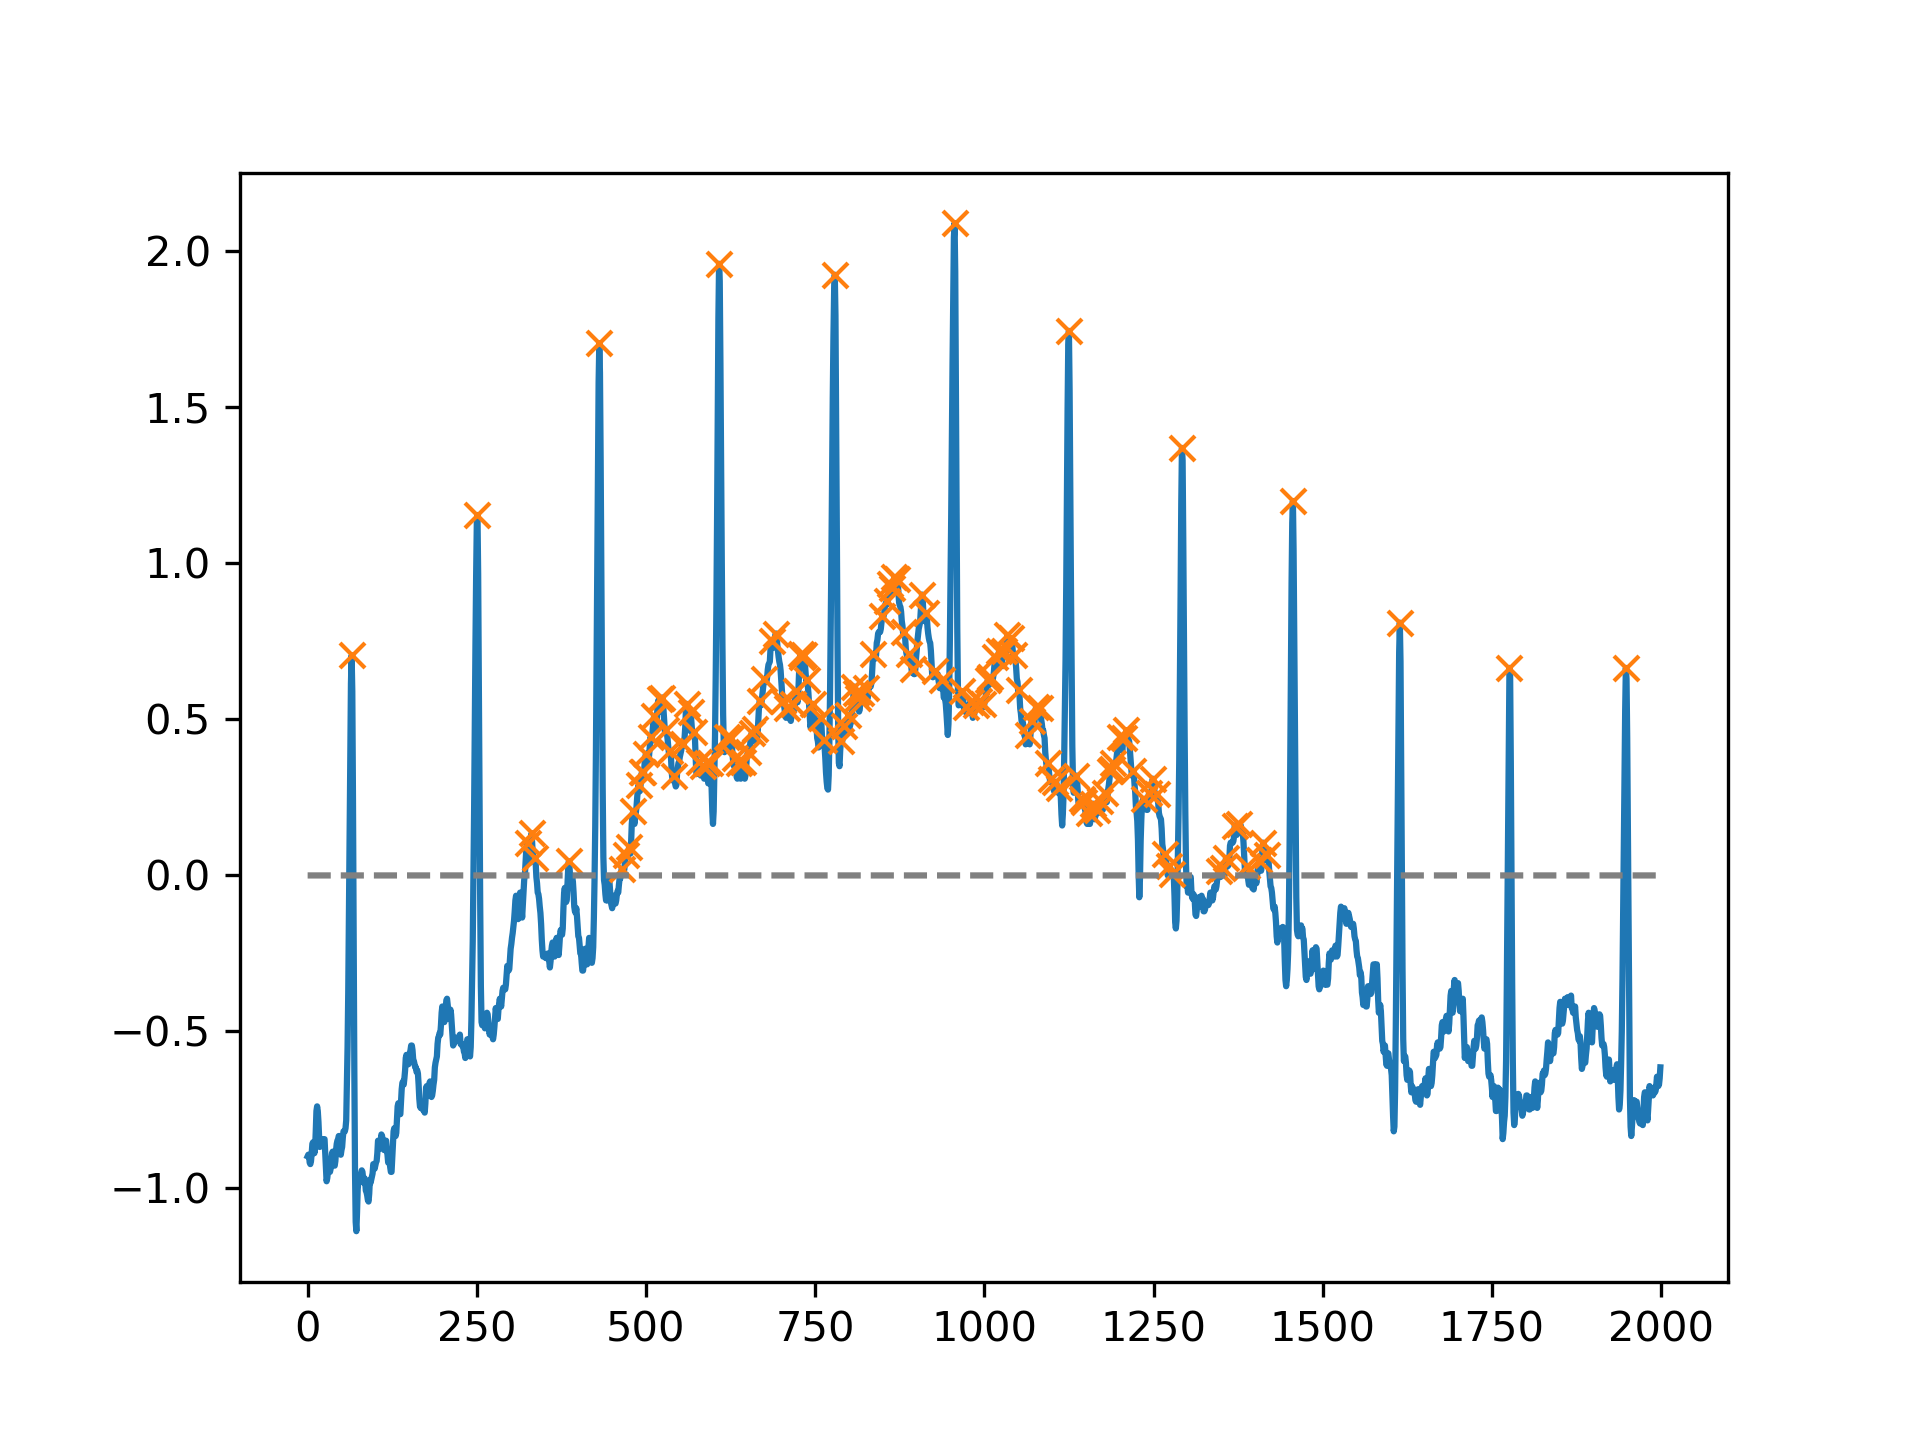
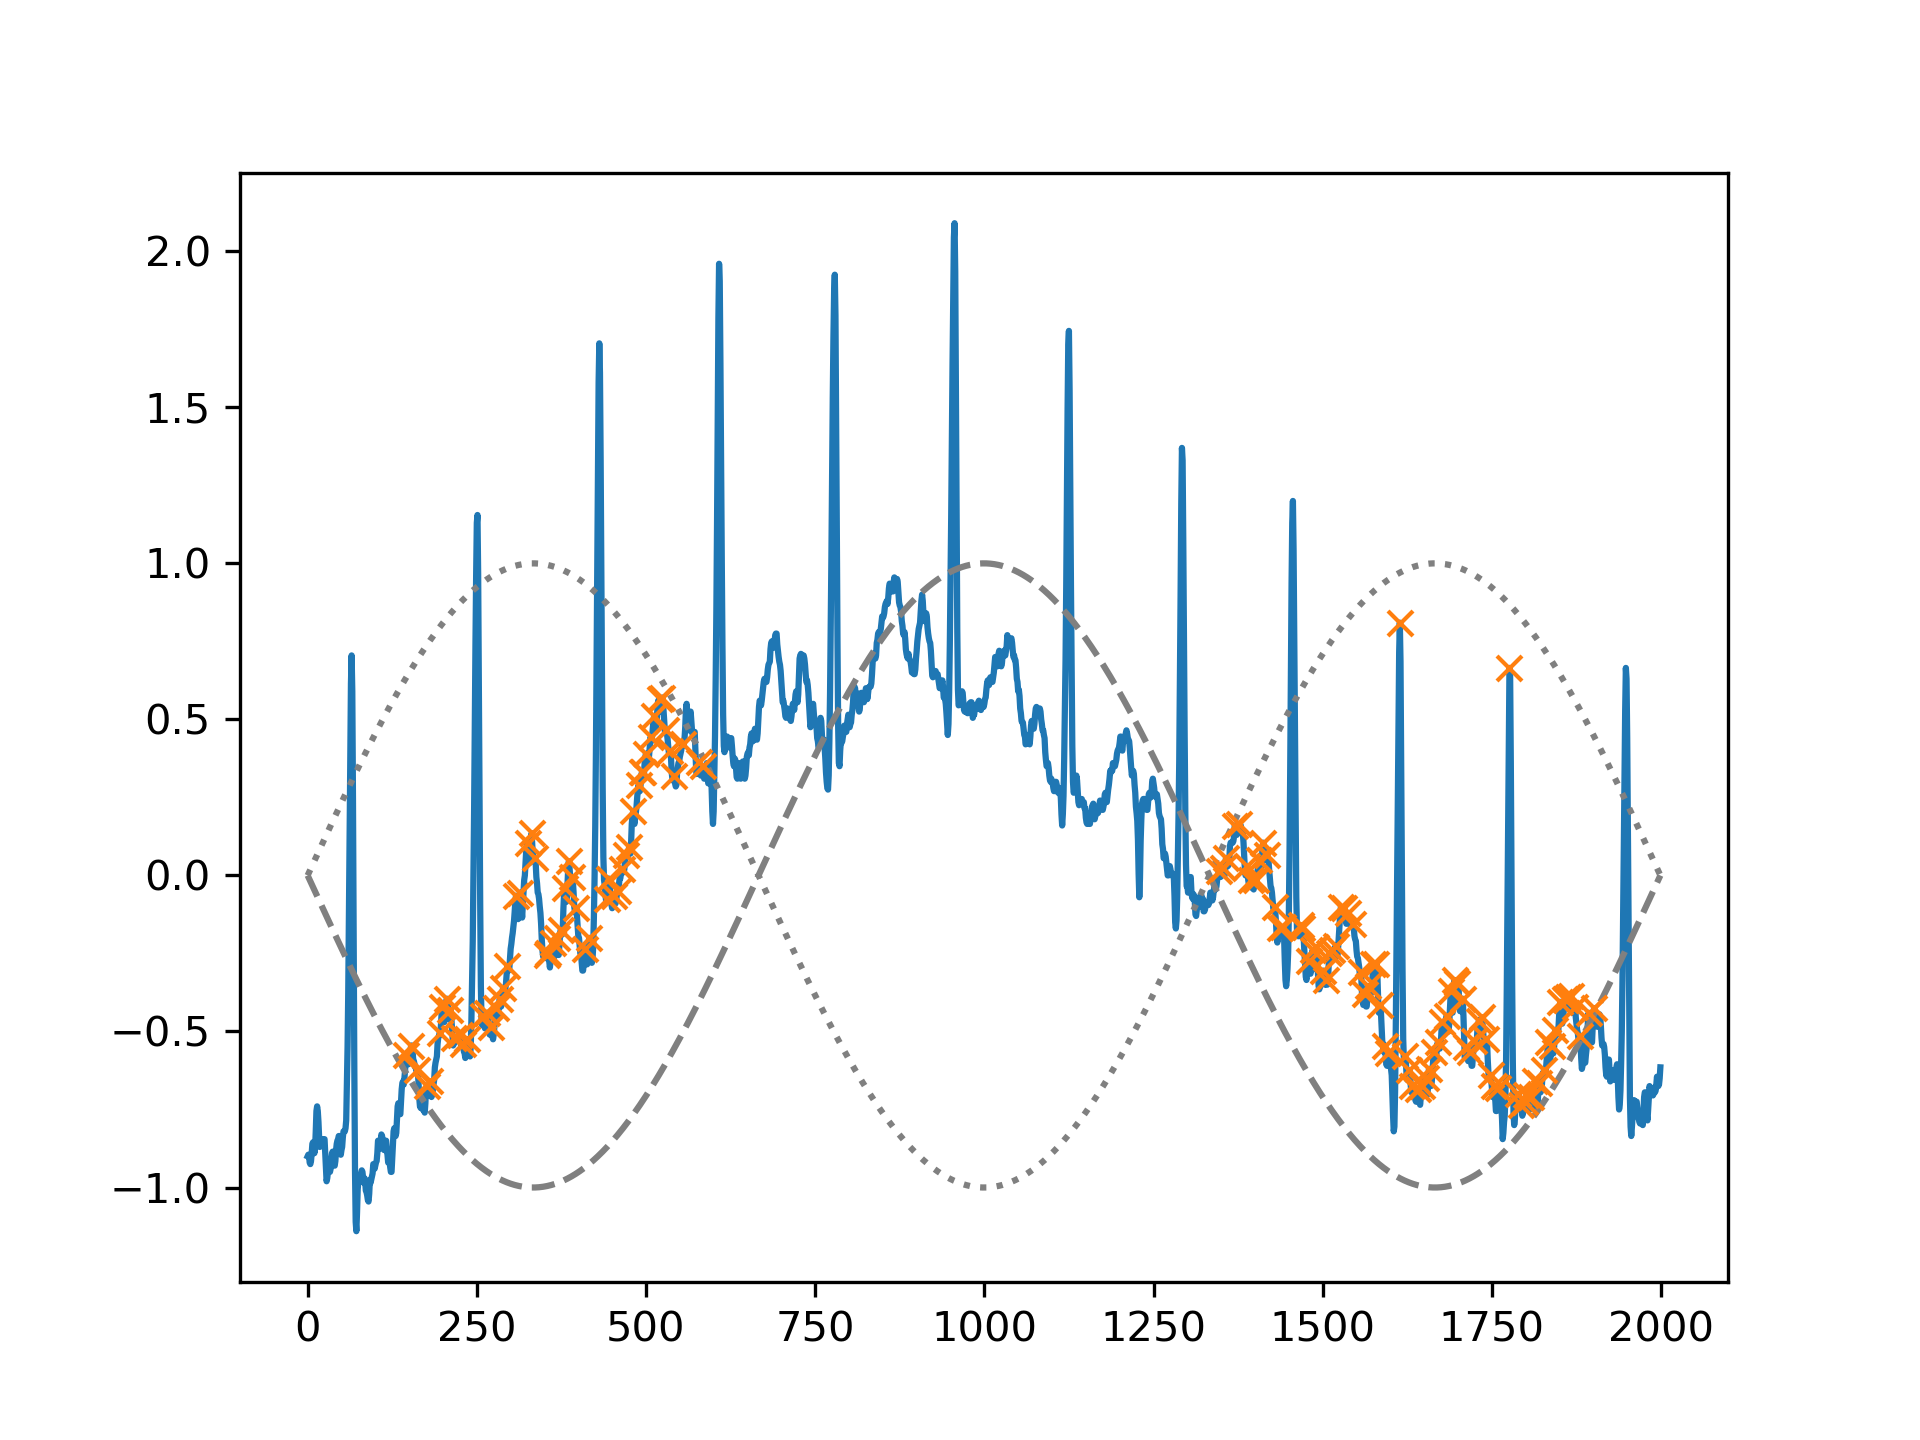
We can select peaks below 0 with height=(None, 0)
or use arrays matching x in size to reflect a changing condition for different parts of the signal.
>>> border = np.sin(np.linspace(0, 3 * np.pi, x.size))
... peaks, _ = find_peaks(x, height=(-border, border))
... plt.plot(x)
... plt.plot(-border, "--", color="gray")
... plt.plot(border, ":", color="gray")
... plt.plot(peaks, x[peaks], "x")
... plt.show()
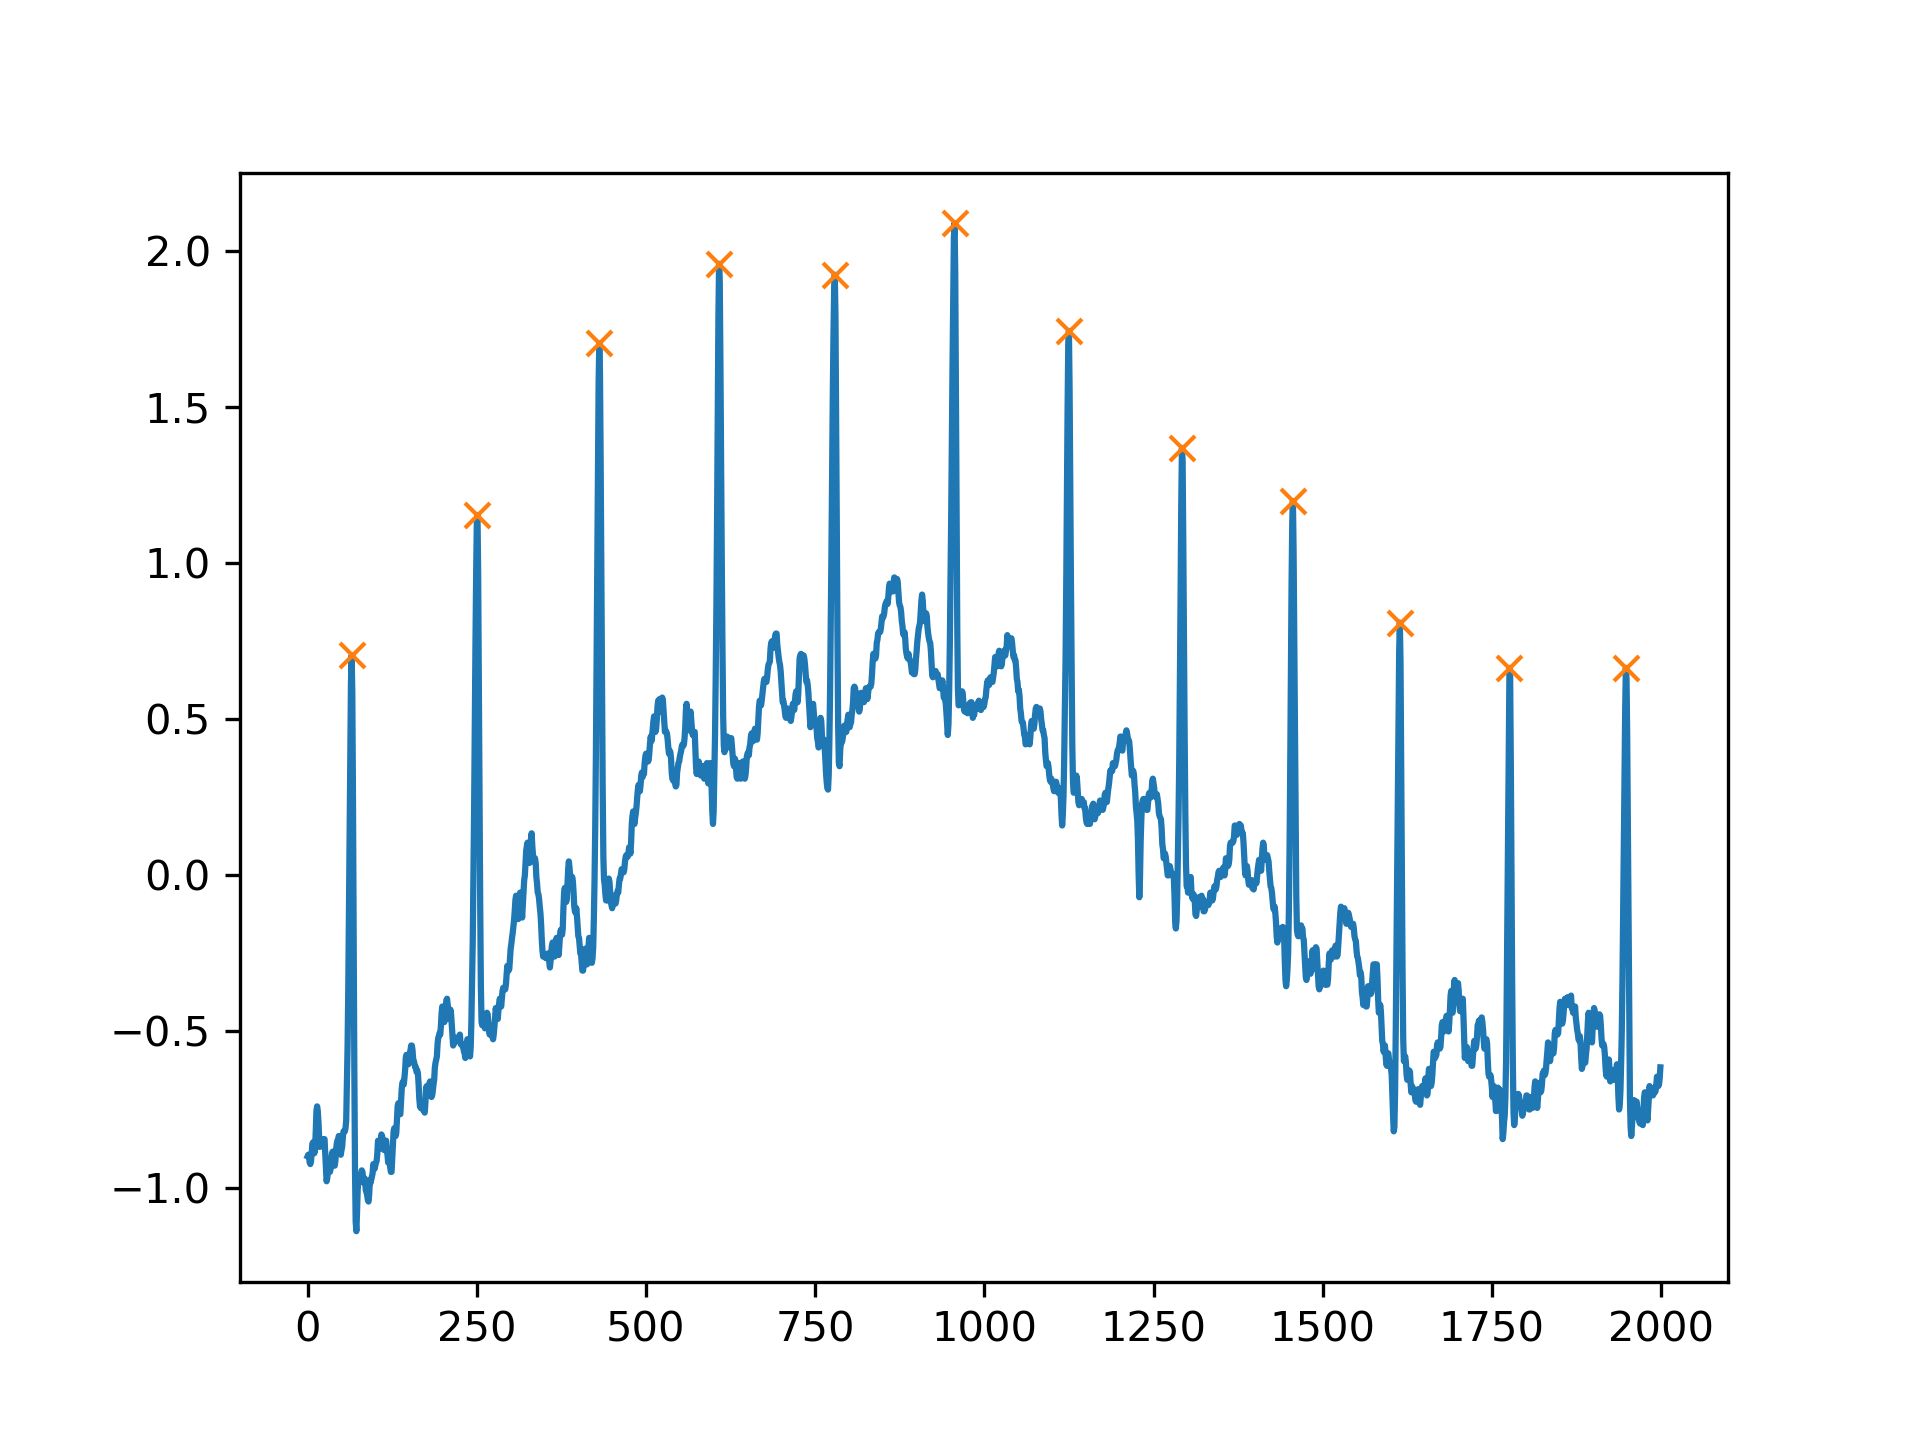
Another useful condition for periodic signals can be given with the distance
argument. In this case, we can easily select the positions of QRS complexes within the electrocardiogram (ECG) by demanding a distance of at least 150 samples.
>>> peaks, _ = find_peaks(x, distance=150)
... np.diff(peaks)
array([186, 180, 177, 171, 177, 169, 167, 164, 158, 162, 172])
>>> plt.plot(x)
... plt.plot(peaks, x[peaks], "x")
... plt.show()
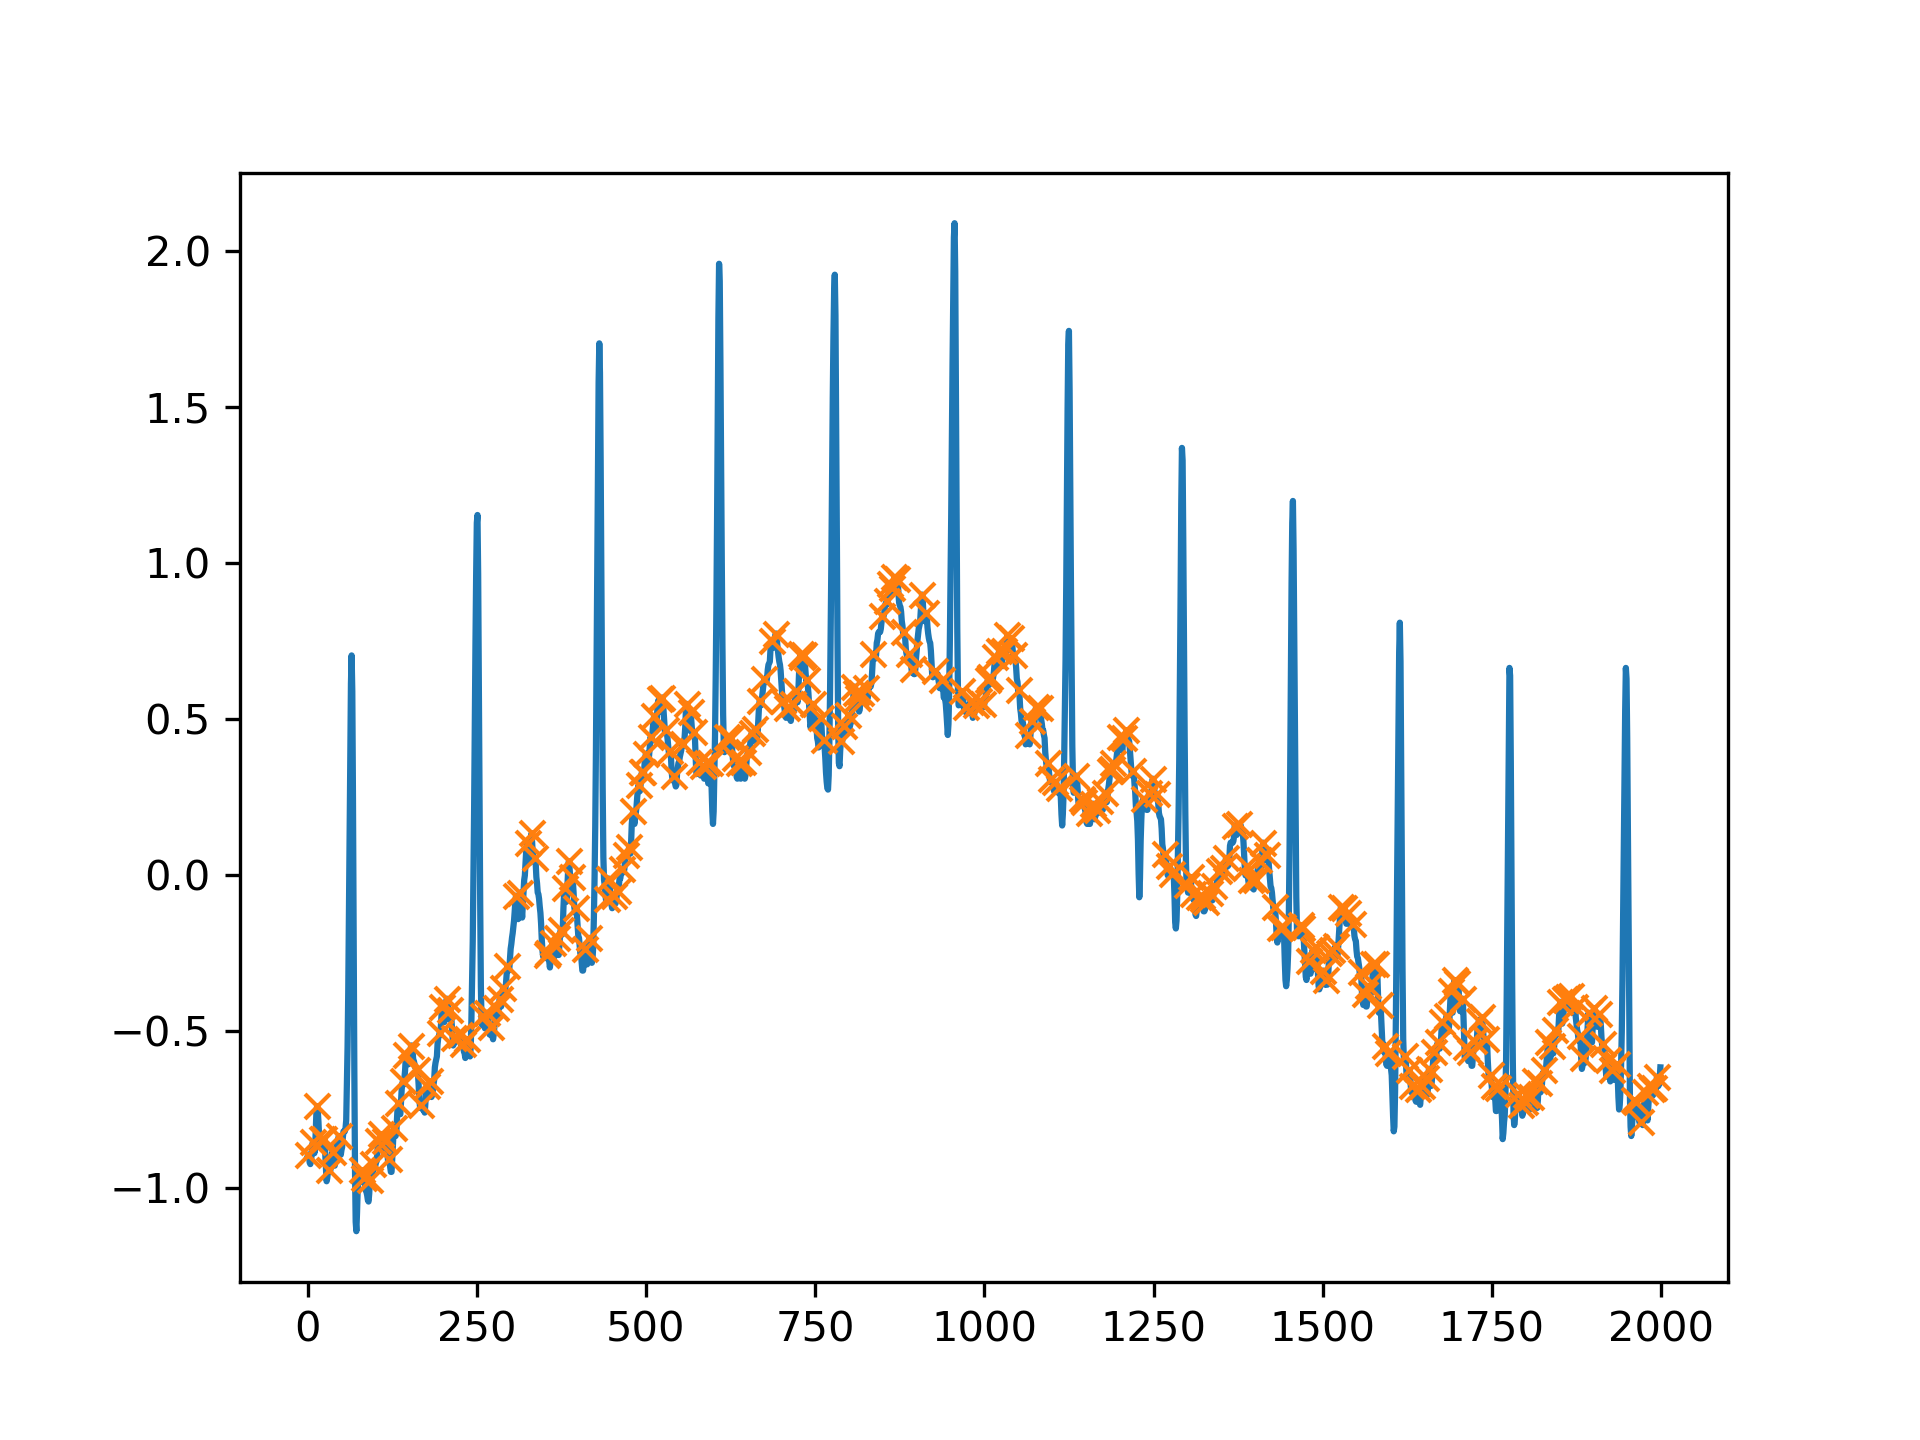
Especially for noisy signals peaks can be easily grouped by their prominence (see peak_prominences
). E.g., we can select all peaks except for the mentioned QRS complexes by limiting the allowed prominence to 0.6.
>>> peaks, properties = find_peaks(x, prominence=(None, 0.6))
... properties["prominences"].max()
0.5049999999999999
>>> plt.plot(x)
... plt.plot(peaks, x[peaks], "x")
... plt.show()
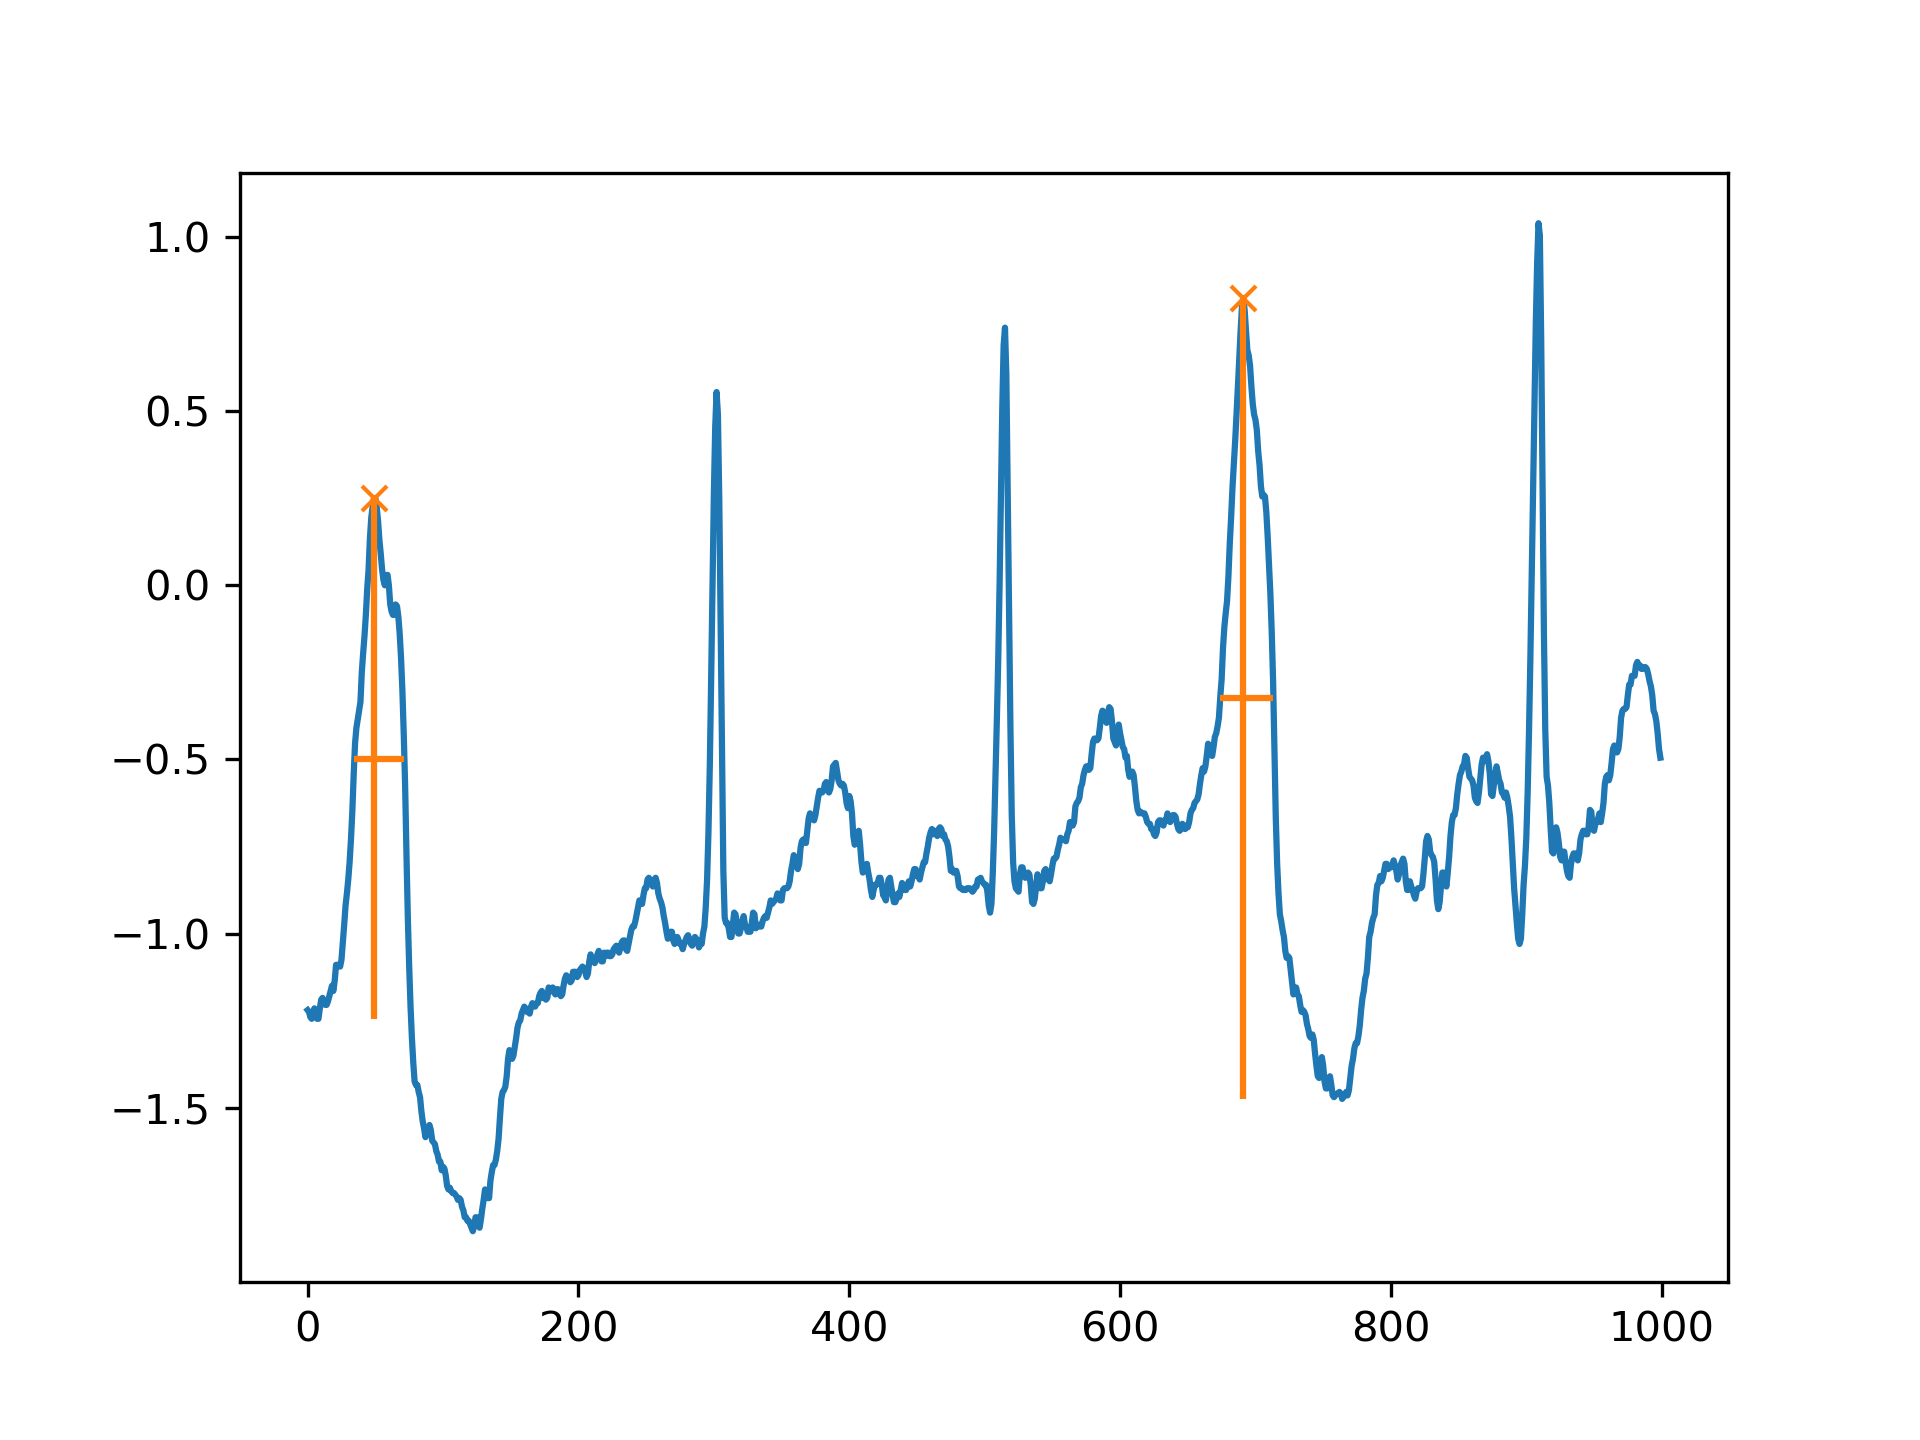
And, finally, let's examine a different section of the ECG which contains beat forms of different shape. To select only the atypical heart beats, we combine two conditions: a minimal prominence of 1 and width of at least 20 samples.
>>> x = electrocardiogram()[17000:18000]
... peaks, properties = find_peaks(x, prominence=1, width=20)
... properties["prominences"], properties["widths"]
(array([1.495, 2.3  ]), array([36.93773946, 39.32723577]))
>>> plt.plot(x)
... plt.plot(peaks, x[peaks], "x")
... plt.vlines(x=peaks, ymin=x[peaks] - properties["prominences"],
...            ymax = x[peaks], color = "C1")
... plt.hlines(y=properties["width_heights"], xmin=properties["left_ips"],
...            xmax=properties["right_ips"], color = "C1")
... plt.show()
The following pages refer to to this document either explicitly or contain code examples using this.
scipy.signal._peak_finding.find_peaks_cwt
scipy.signal._peak_finding.argrelmax
scipy.signal._peak_finding._unpack_condition_args
scipy.signal._peak_finding.argrelmin
scipy.signal._peak_finding._arg_x_as_expected
scipy.signal._peak_finding.peak_prominences
scipy.signal._peak_finding.find_peaks
scipy.signal._peak_finding._select_by_property
scipy.signal._peak_finding.peak_widths
Hover to see nodes names; edges to Self not shown, Caped at 50 nodes.
Using a canvas is more power efficient and can get hundred of nodes ; but does not allow hyperlinks; , arrows or text (beyond on hover)
SVG is more flexible but power hungry; and does not scale well to 50 + nodes.
All aboves nodes referred to, (or are referred from) current nodes; Edges from Self to other have been omitted (or all nodes would be connected to the central node "self" which is not useful). Nodes are colored by the library they belong to, and scaled with the number of references pointing them