integrate(self, a, b, extrapolate=None)
Lower limit of integration.
Upper limit of integration.
whether to extrapolate beyond the base interval, t[k] .. t[-k-1]
, or take the spline to be zero outside of the base interval. If 'periodic', periodic extrapolation is used. If None (default), use :None:None:`self.extrapolate`.
Definite integral of the spline over the interval [a, b]
.
Compute a definite integral of the spline.
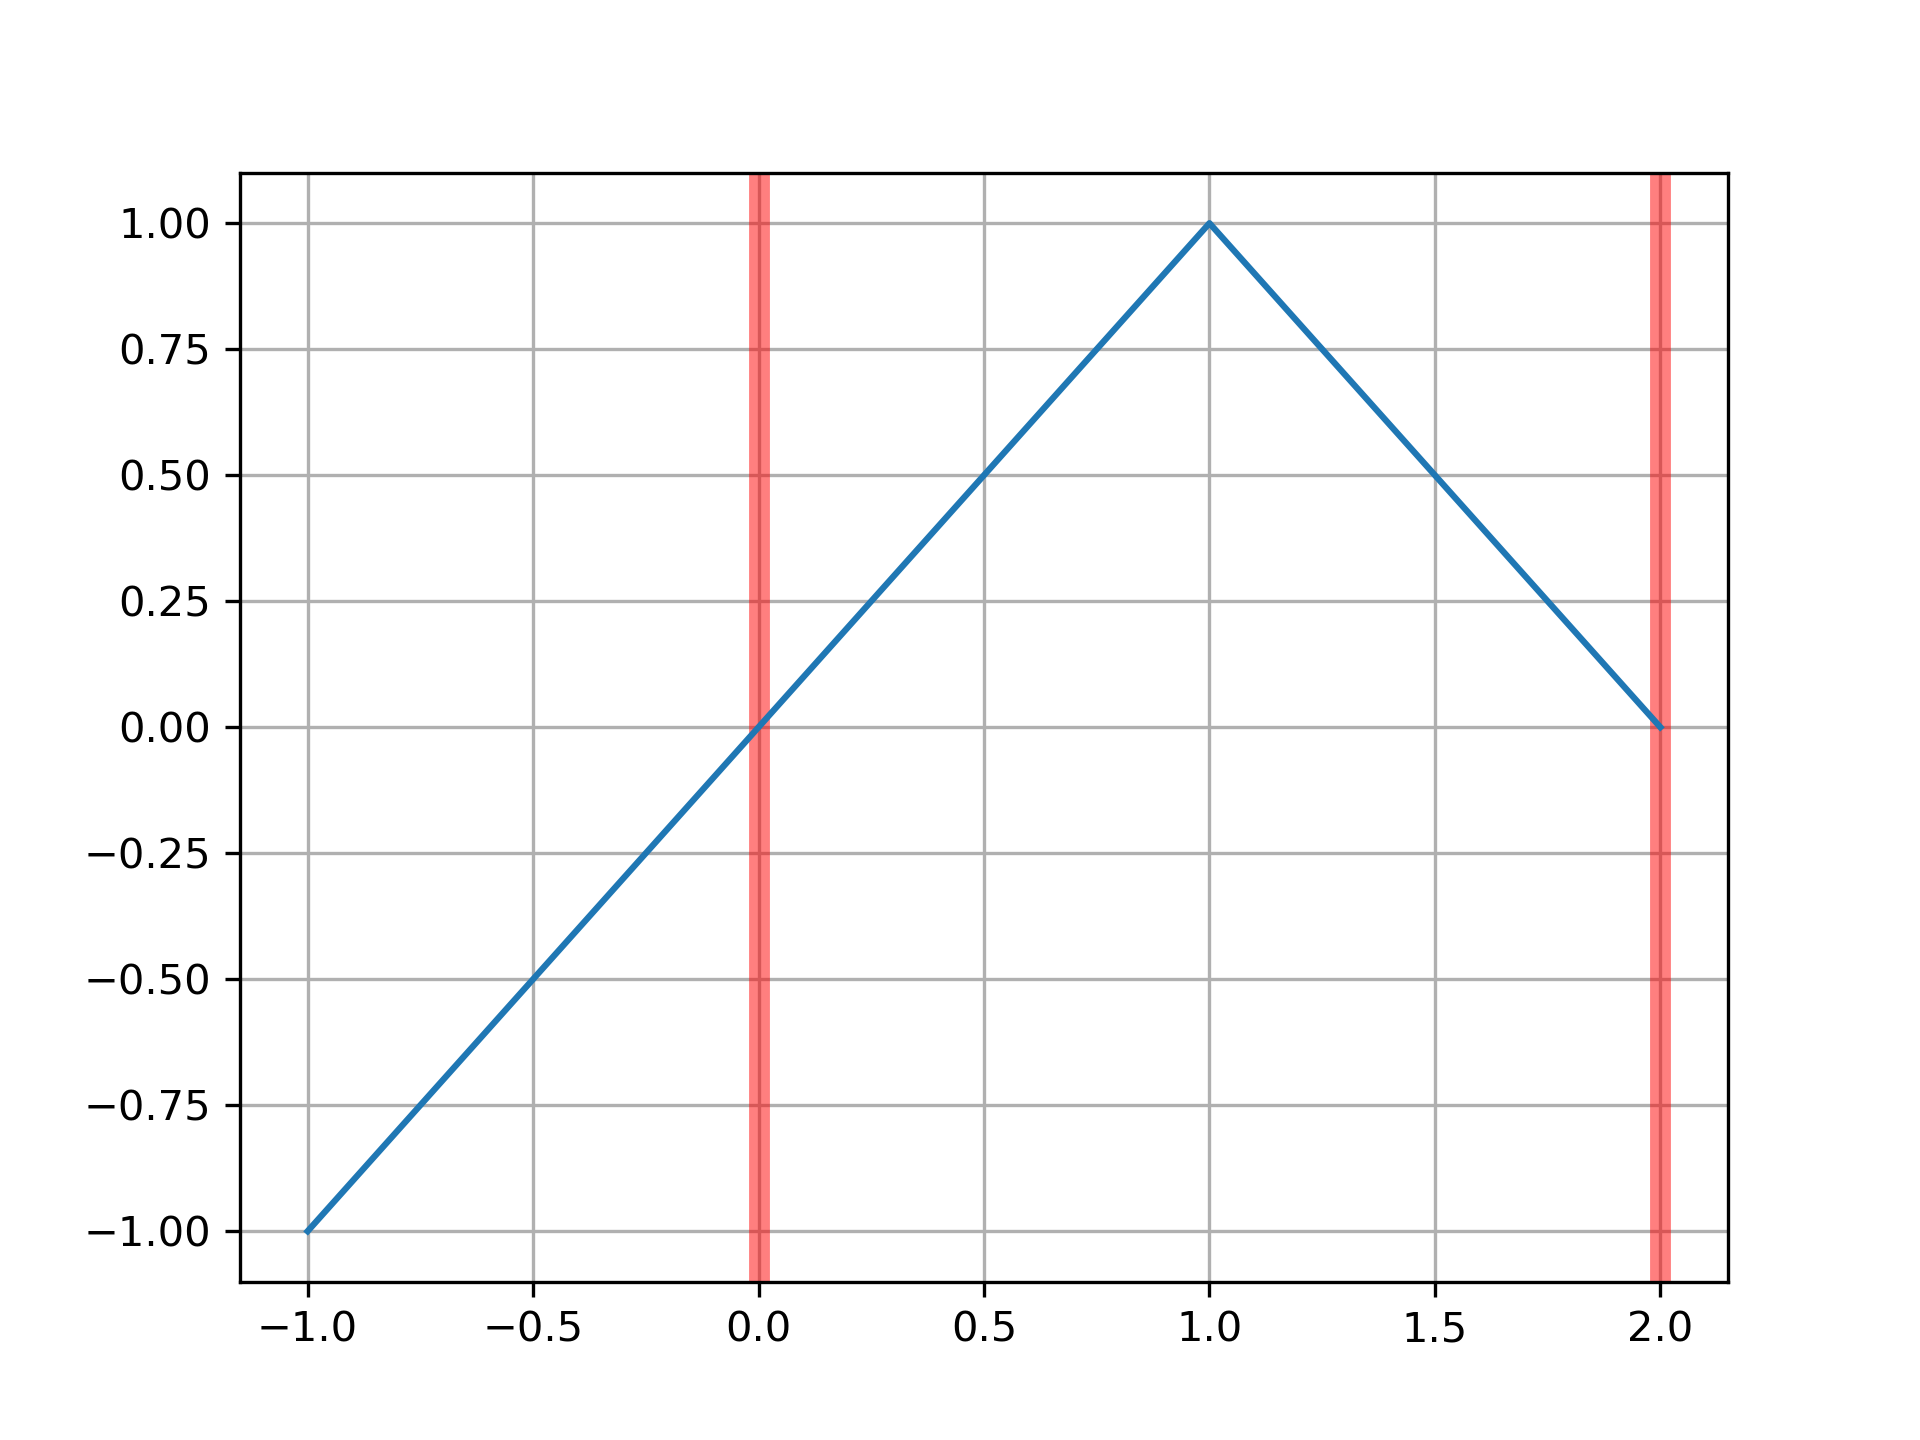
Construct the linear spline x if x < 1 else 2 - x
on the base interval $[0, 2]$
, and integrate it
>>> from scipy.interpolate import BSpline
... b = BSpline.basis_element([0, 1, 2])
... b.integrate(0, 1)
array(0.5)
If the integration limits are outside of the base interval, the result is controlled by the extrapolate
parameter
>>> b.integrate(-1, 1)
array(0.0)
>>> b.integrate(-1, 1, extrapolate=False)
array(0.5)
>>> import matplotlib.pyplot as plt
... fig, ax = plt.subplots()
... ax.grid(True)
... ax.axvline(0, c='r', lw=5, alpha=0.5)  # base interval
... ax.axvline(2, c='r', lw=5, alpha=0.5)
... xx = [-1, 1, 2]
... ax.plot(xx, b(xx))
... plt.show()
Hover to see nodes names; edges to Self not shown, Caped at 50 nodes.
Using a canvas is more power efficient and can get hundred of nodes ; but does not allow hyperlinks; , arrows or text (beyond on hover)
SVG is more flexible but power hungry; and does not scale well to 50 + nodes.
All aboves nodes referred to, (or are referred from) current nodes; Edges from Self to other have been omitted (or all nodes would be connected to the central node "self" which is not useful). Nodes are colored by the library they belong to, and scaled with the number of references pointing them