krogh_interpolate(xi, yi, x, der=0, axis=0)
See KroghInterpolator
for more details.
Construction of the interpolating polynomial is a relatively expensive process. If you want to evaluate it repeatedly consider using the class KroghInterpolator (which is what this function uses).
Known x-coordinates.
Known y-coordinates, of shape (xi.size, R)
. Interpreted as vectors of length R, or scalars if R=1.
Point or points at which to evaluate the derivatives.
How many derivatives to extract; None for all potentially nonzero derivatives (that is a number equal to the number of points), or a list of derivatives to extract. This number includes the function value as 0th derivative.
Axis in the yi array corresponding to the x-coordinate values.
If the interpolator's values are R-D then the returned array will be the number of derivatives by N by R. If x is a scalar, the middle dimension will be dropped; if the :None:None:`yi` are scalars then the last dimension will be dropped.
Convenience function for polynomial interpolation.
KroghInterpolator
Krogh interpolator
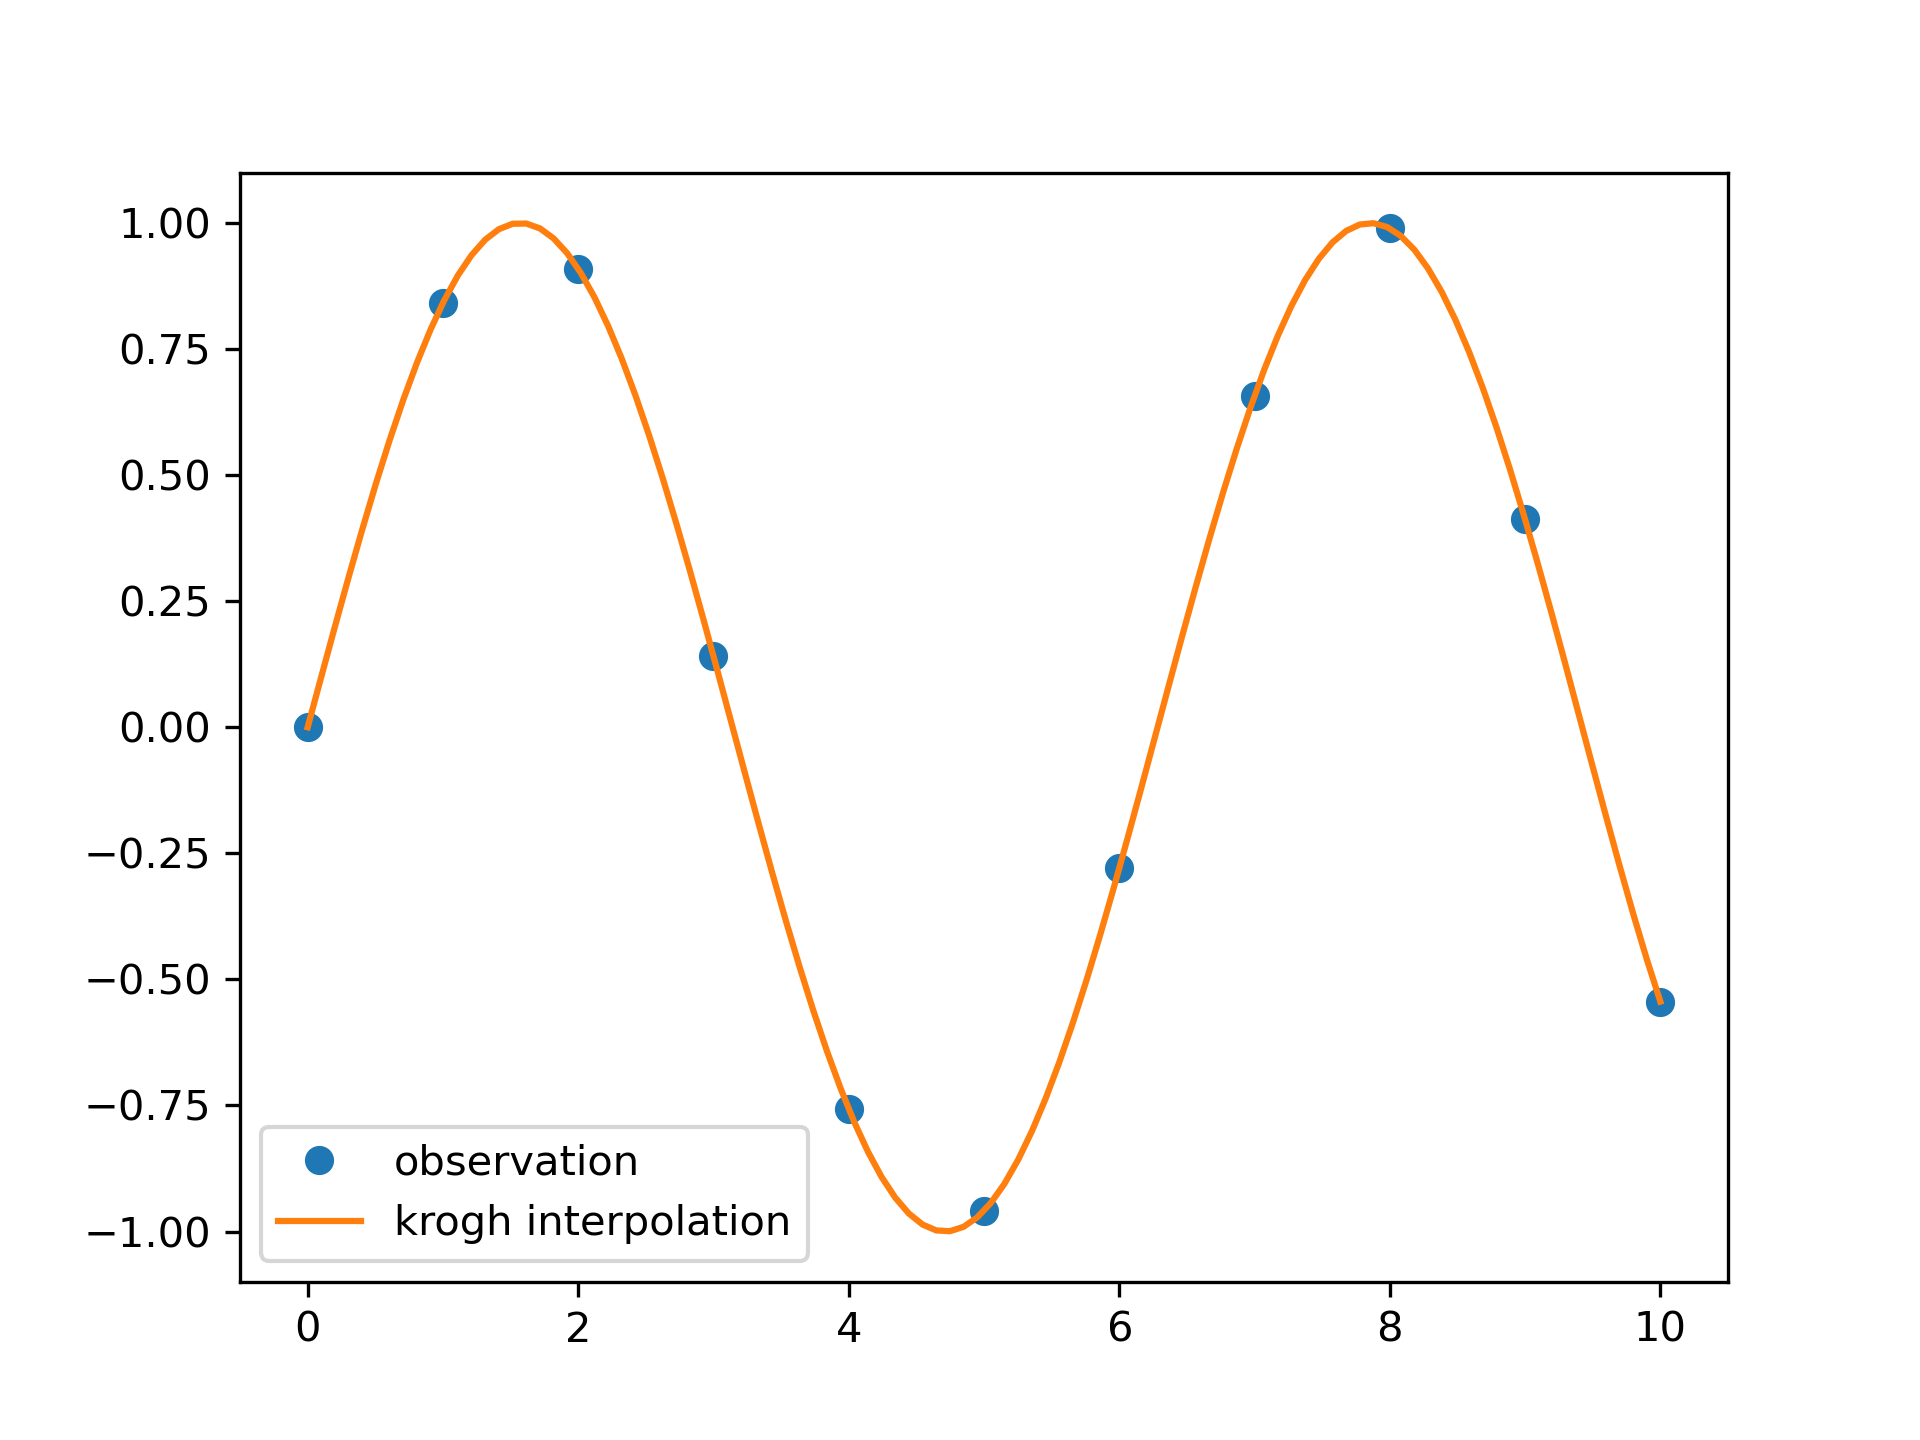
We can interpolate 2D observed data using krogh interpolation:
>>> import matplotlib.pyplot as plt
... from scipy.interpolate import krogh_interpolate
... x_observed = np.linspace(0.0, 10.0, 11)
... y_observed = np.sin(x_observed)
... x = np.linspace(min(x_observed), max(x_observed), num=100)
... y = krogh_interpolate(x_observed, y_observed, x)
... plt.plot(x_observed, y_observed, "o", label="observation")
... plt.plot(x, y, label="krogh interpolation")
... plt.legend()
... plt.show()
The following pages refer to to this document either explicitly or contain code examples using this.
scipy.interpolate._polyint.krogh_interpolate
Hover to see nodes names; edges to Self not shown, Caped at 50 nodes.
Using a canvas is more power efficient and can get hundred of nodes ; but does not allow hyperlinks; , arrows or text (beyond on hover)
SVG is more flexible but power hungry; and does not scale well to 50 + nodes.
All aboves nodes referred to, (or are referred from) current nodes; Edges from Self to other have been omitted (or all nodes would be connected to the central node "self" which is not useful). Nodes are colored by the library they belong to, and scaled with the number of references pointing them