cumulative_trapezoid(y, x=None, dx=1.0, axis=-1, initial=None)
Values to integrate.
The coordinate to integrate along. If None (default), use spacing dx
between consecutive elements in y.
Specifies the axis to cumulate. Default is -1 (last axis).
If given, insert this value at the beginning of the returned result. Typically this value should be 0. Default is None, which means no value at x[0]
is returned and :None:None:`res` has one element less than y along the axis of integration.
The result of cumulative integration of y along :None:None:`axis`. If :None:None:`initial` is None, the shape is such that the axis of integration has one less value than y. If :None:None:`initial` is given, the shape is equal to that of y.
Cumulatively integrate y(x) using the composite trapezoidal rule.
dblquad
double integrals
fixed_quad
fixed-order Gaussian quadrature
ode
ODE integrators
odeint
ODE integrators
quad
adaptive quadrature using QUADPACK
quadrature
adaptive Gaussian quadrature
romb
integrators for sampled data
romberg
adaptive Romberg quadrature
tplquad
triple integrals
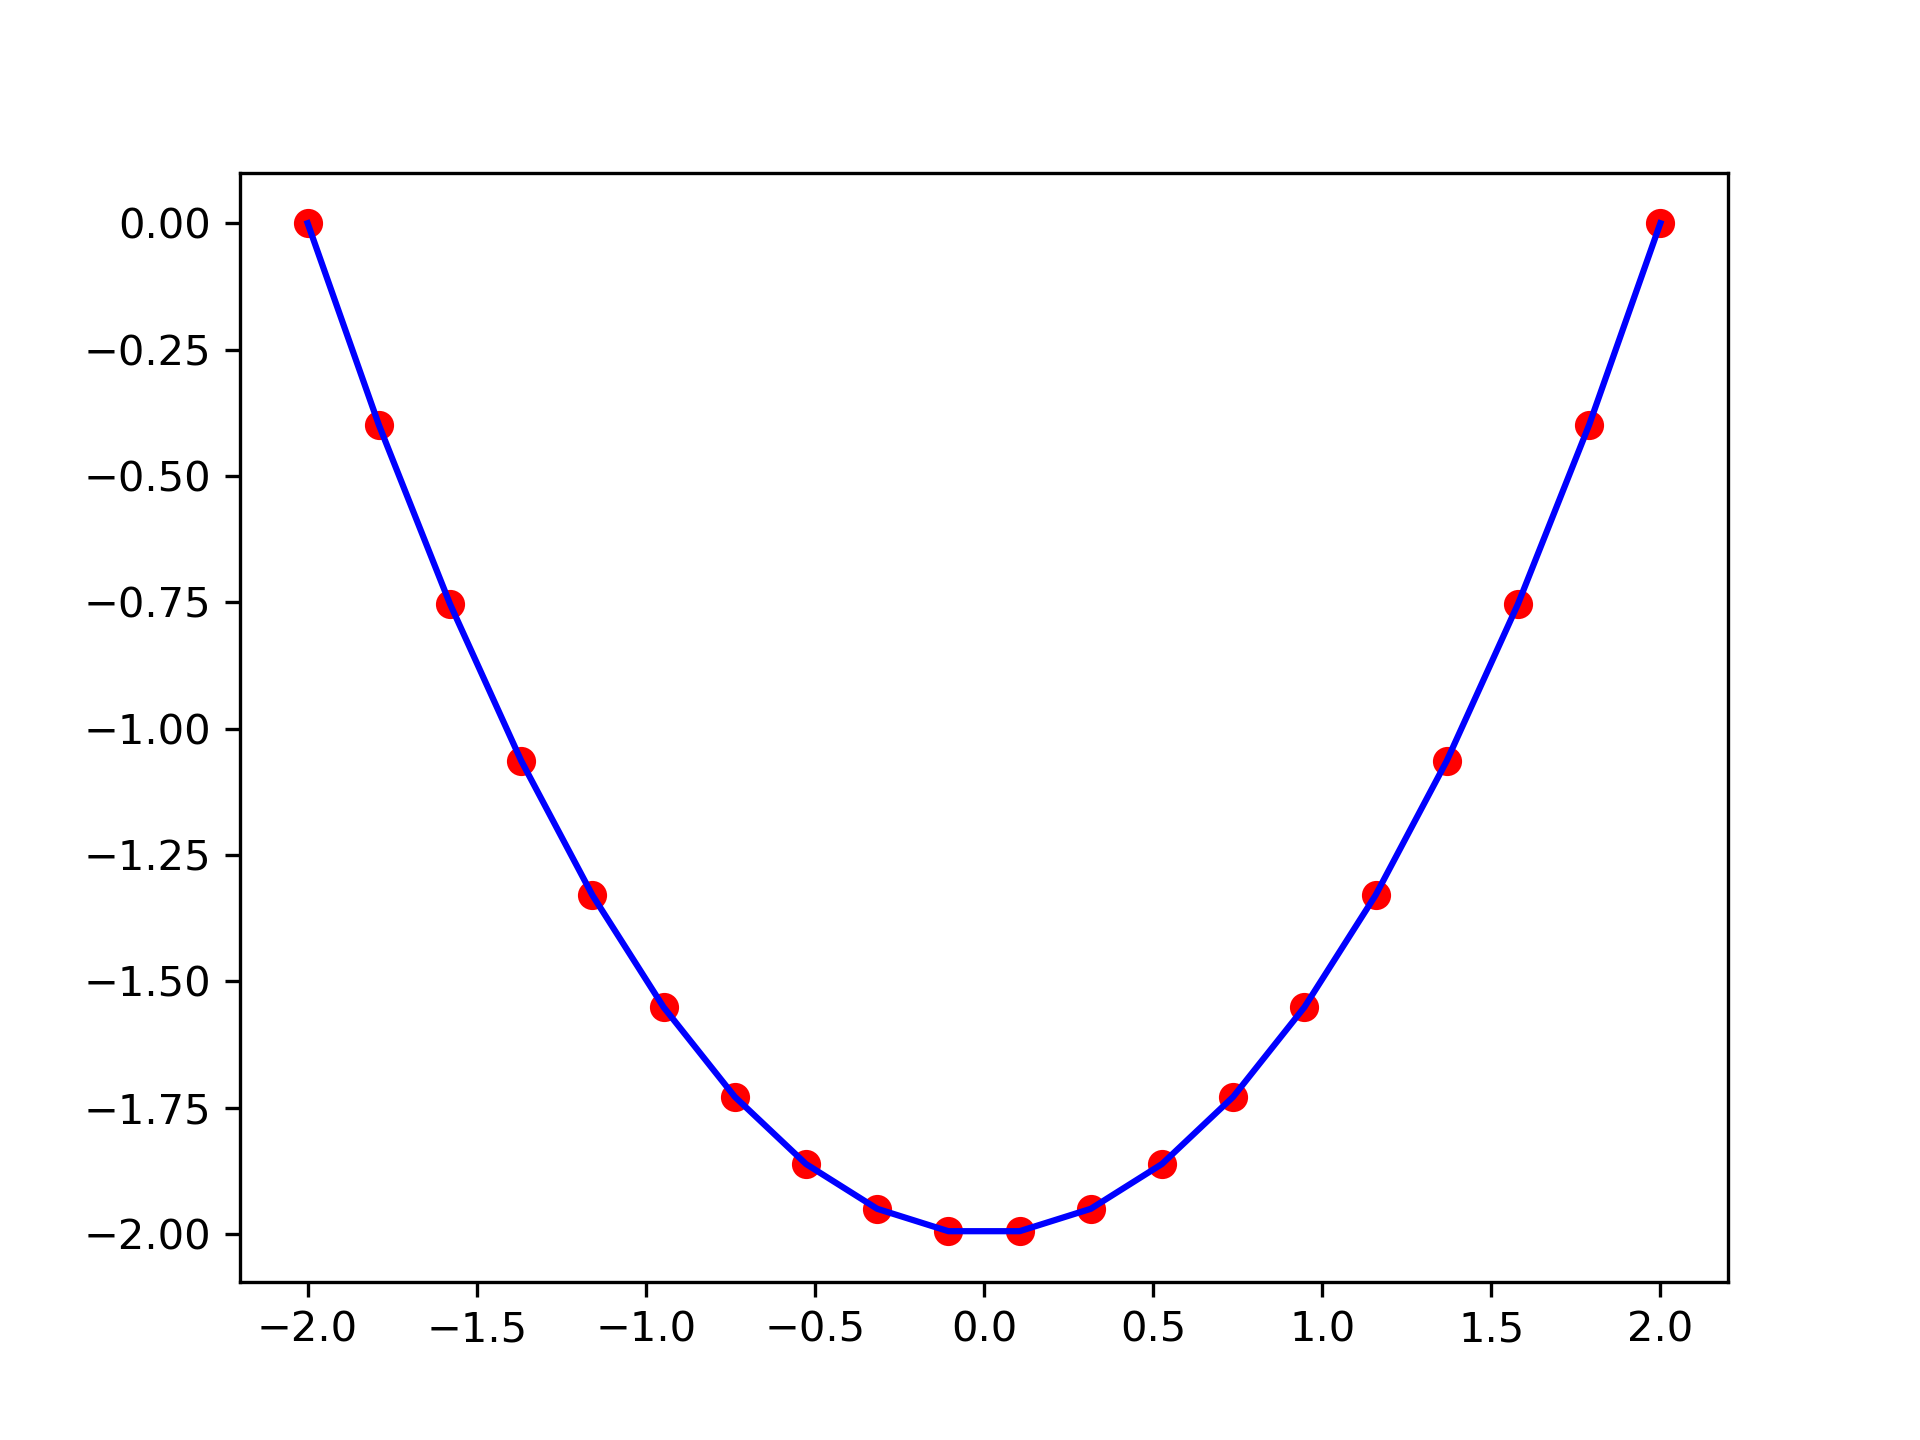
>>> from scipy import integrate
... import matplotlib.pyplot as plt
>>> x = np.linspace(-2, 2, num=20)
... y = x
... y_int = integrate.cumulative_trapezoid(y, x, initial=0)
... plt.plot(x, y_int, 'ro', x, y[0] + 0.5 * x**2, 'b-')
... plt.show()
The following pages refer to to this document either explicitly or contain code examples using this.
scipy.integrate._quadrature.simpson
scipy.integrate._quadrature.quadrature
scipy.integrate._quadrature.romb
scipy.integrate._quadrature.fixed_quad
scipy.integrate._quadrature.cumulative_trapezoid
scipy.integrate._quadrature.cumtrapz
scipy.integrate._quadrature.romberg
Hover to see nodes names; edges to Self not shown, Caped at 50 nodes.
Using a canvas is more power efficient and can get hundred of nodes ; but does not allow hyperlinks; , arrows or text (beyond on hover)
SVG is more flexible but power hungry; and does not scale well to 50 + nodes.
All aboves nodes referred to, (or are referred from) current nodes; Edges from Self to other have been omitted (or all nodes would be connected to the central node "self" which is not useful). Nodes are colored by the library they belong to, and scaled with the number of references pointing them