Delaunay(points, furthest_site=False, incremental=False, qhull_options=None)Coordinates of input points.
Indices of the points forming the simplices in the triangulation. For 2-D, the points are oriented counterclockwise.
Indices of neighbor simplices for each simplex. The kth neighbor is opposite to the kth vertex. For simplices at the boundary, -1 denotes no neighbor.
[normal, offset] forming the hyperplane equation of the facet on the paraboloid (see Qhull documentation for more).
Scale and shift for the extra paraboloid dimension (see Qhull documentation for more).
Affine transform from x
to the barycentric coordinates c
. This is defined by:
T c = x - r
At vertex j
, c_j = 1
and the other coordinates zero.
For simplex i
, transform[i,:ndim,:ndim]
contains inverse of the matrix T
, and transform[i,ndim,:]
contains the vector r
.
If the simplex is degenerate or nearly degenerate, its barycentric transform contains NaNs.
Lookup array, from a vertex, to some simplex which it is a part of. If qhull option "Qc" was not specified, the list will contain -1 for points that are not vertices of the tessellation.
Vertices of facets forming the convex hull of the point set. The array contains the indices of the points belonging to the (N-1)-dimensional facets that form the convex hull of the triangulation.
Computing convex hulls via the Delaunay triangulation is inefficient and subject to increased numerical instability. Use :None:None:`ConvexHull` instead.
Indices of coplanar points and the corresponding indices of the nearest facet and the nearest vertex. Coplanar points are input points which were not included in the triangulation due to numerical precision issues.
If option "Qc" is not specified, this list is not computed.
Same as :None:None:`simplices`, but deprecated.
Neighboring vertices of vertices. The indices of neighboring vertices of vertex :None:None:`k` are indices[indptr[k]:indptr[k+1]]
.
True if this was a furthest site triangulation and False if not.
The tessellation is computed using the Qhull library Qhull library.
Unless you pass in the Qhull option "QJ", Qhull does not guarantee that each input point appears as a vertex in the Delaunay triangulation. Omitted points are listed in the :None:None:`coplanar` attribute.
Coordinates of points to triangulate
Whether to compute a furthest-site Delaunay triangulation. Default: False
Allow adding new points incrementally. This takes up some additional resources.
Additional options to pass to Qhull. See Qhull manual for details. Option "Qt" is always enabled. Default:"Qbb Qc Qz Qx Q12" for ndim > 4 and "Qbb Qc Qz Q12" otherwise. Incremental mode omits "Qz".
Raised when Qhull encounters an error condition, such as geometrical degeneracy when options to resolve are not enabled.
Raised if an incompatible array is given as input.
Delaunay tessellation in N dimensions.
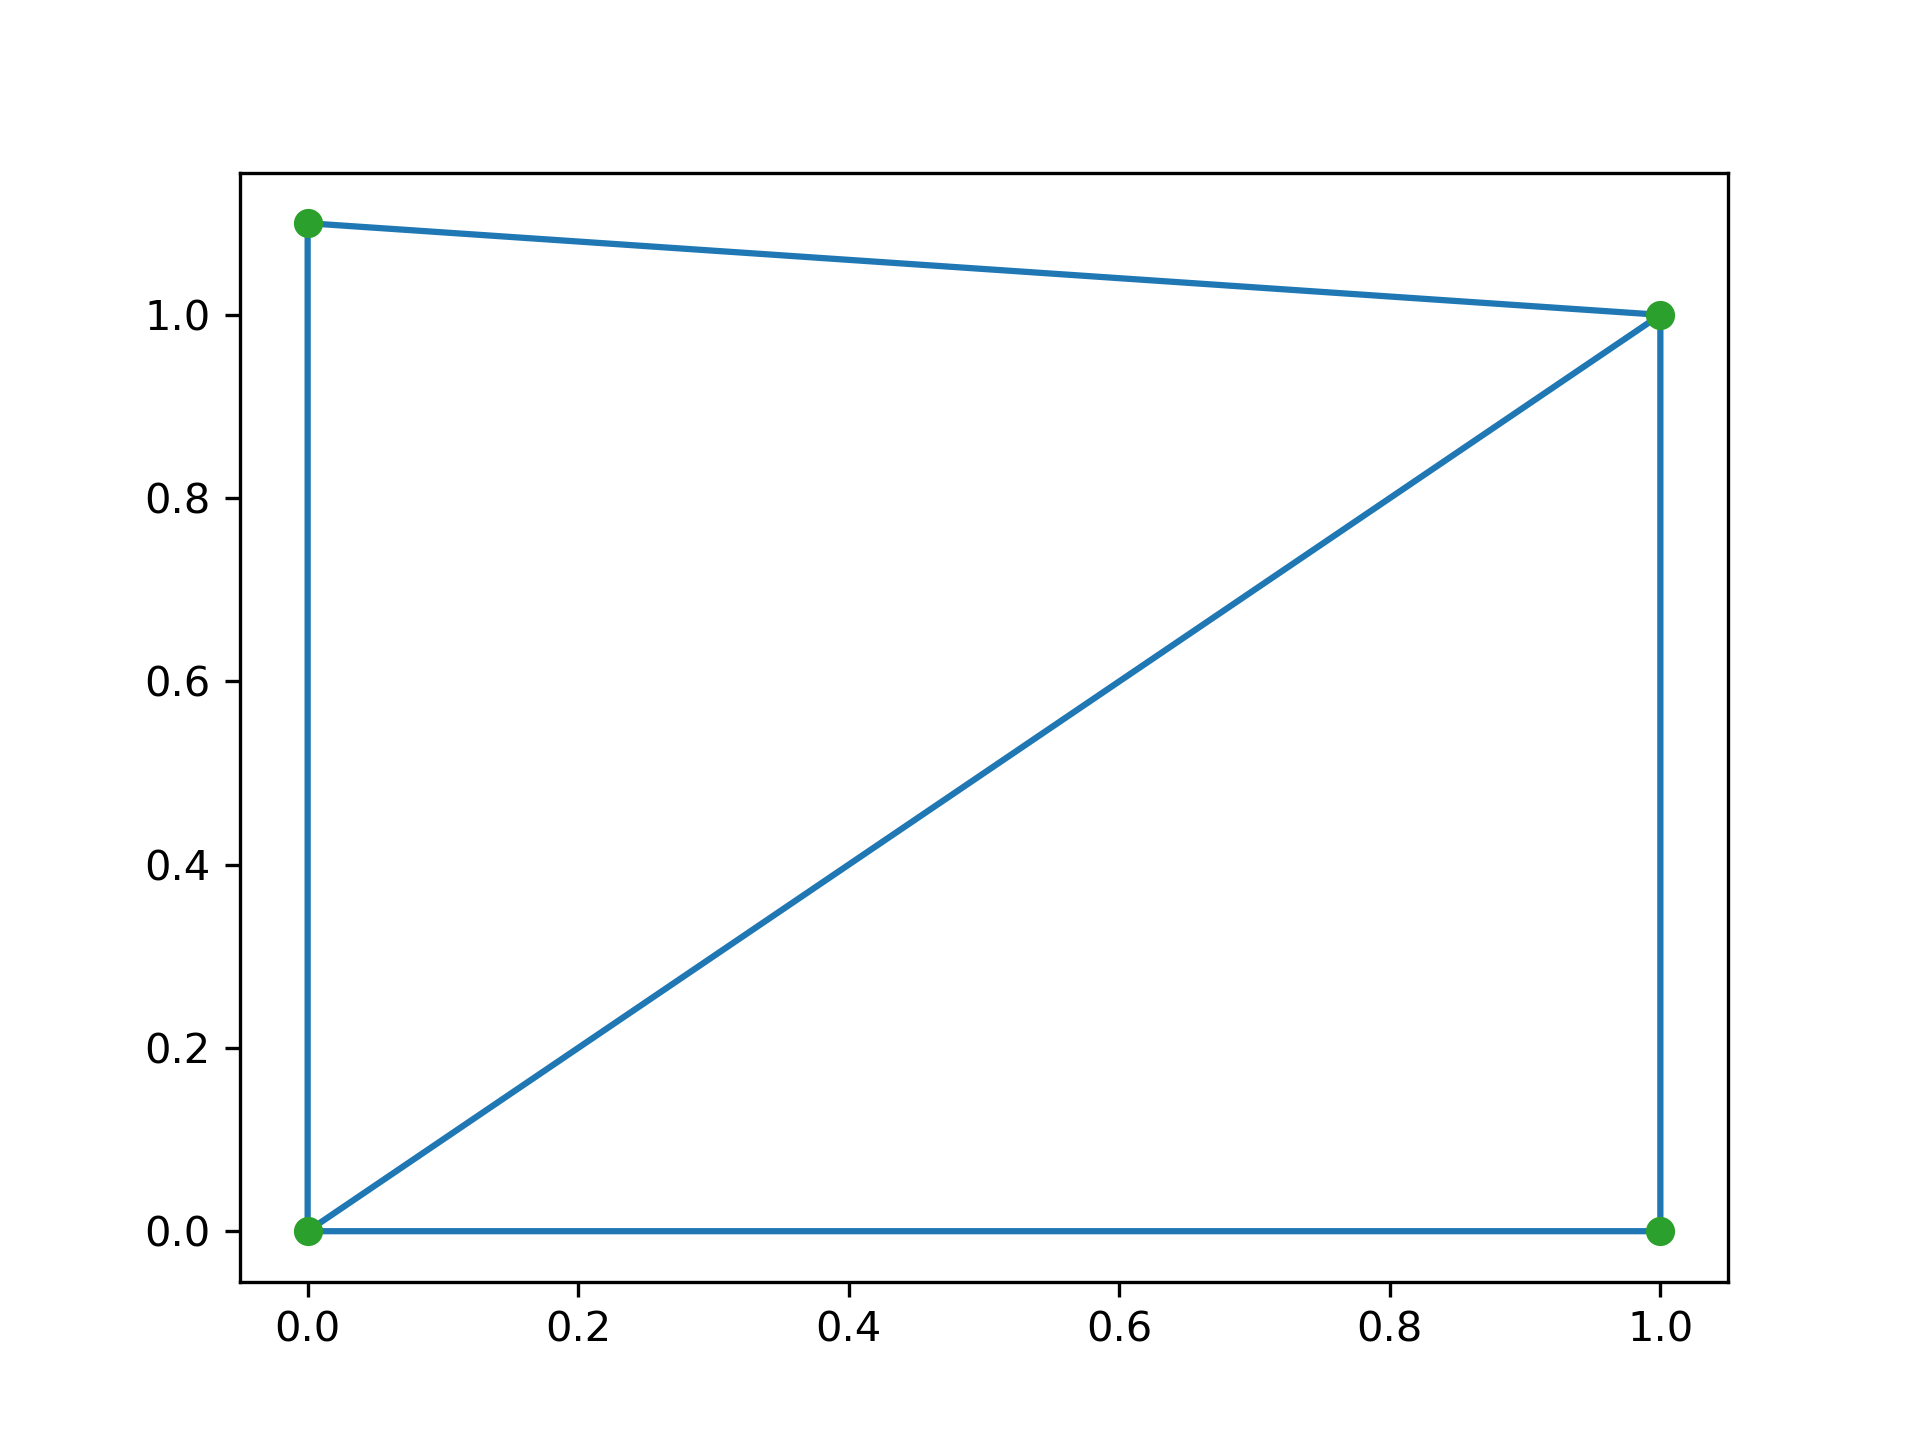
Triangulation of a set of points:
>>> points = np.array([[0, 0], [0, 1.1], [1, 0], [1, 1]])
... from scipy.spatial import Delaunay
... tri = Delaunay(points)
We can plot it:
>>> import matplotlib.pyplot as plt
... plt.triplot(points[:,0], points[:,1], tri.simplices)
... plt.plot(points[:,0], points[:,1], 'o')
... plt.show()
Point indices and coordinates for the two triangles forming the triangulation:
>>> tri.simplices
array([[2, 3, 0],                 # may vary
       [3, 1, 0]], dtype=int32)
Note that depending on how rounding errors go, the simplices may be in a different order than above.
>>> points[tri.simplices]
array([[[ 1. ,  0. ],            # may vary
        [ 1. ,  1. ],
        [ 0. ,  0. ]],
       [[ 1. ,  1. ],
        [ 0. ,  1.1],
        [ 0. ,  0. ]]])
Triangle 0 is the only neighbor of triangle 1, and it's opposite to vertex 1 of triangle 1:
>>> tri.neighbors[1]
array([-1,  0, -1], dtype=int32)
>>> points[tri.simplices[1,1]]
array([ 0. ,  1.1])
We can find out which triangle points are in:
>>> p = np.array([(0.1, 0.2), (1.5, 0.5), (0.5, 1.05)])
... tri.find_simplex(p)
array([ 1, -1, 1], dtype=int32)
The returned integers in the array are the indices of the simplex the corresponding point is in. If -1 is returned, the point is in no simplex. Be aware that the shortcut in the following example only works corretcly for valid points as invalid points result in -1 which is itself a valid index for the last simplex in the list.
>>> p_valids = np.array([(0.1, 0.2), (0.5, 1.05)])
... tri.simplices[tri.find_simplex(p_valids)]
array([[3, 1, 0],                 # may vary
       [3, 1, 0]], dtype=int32)
We can also compute barycentric coordinates in triangle 1 for these points:
>>> b = tri.transform[1,:2].dot(np.transpose(p - tri.transform[1,2]))
... np.c_[np.transpose(b), 1 - b.sum(axis=0)]
array([[ 0.1       ,  0.09090909,  0.80909091],
       [ 1.5       , -0.90909091,  0.40909091],
       [ 0.5       ,  0.5       ,  0.        ]])
The coordinates for the first point are all positive, meaning it is indeed inside the triangle. The third point is on a vertex, hence its null third coordinate.
See :The following pages refer to to this document either explicitly or contain code examples using this.
scipy.spatial._qhull.tsearch
scipy.spatial._qhull.Delaunay
scipy.spatial._plotutils.delaunay_plot_2d
Hover to see nodes names; edges to Self not shown, Caped at 50 nodes.
Using a canvas is more power efficient and can get hundred of nodes ; but does not allow hyperlinks; , arrows or text (beyond on hover)
SVG is more flexible but power hungry; and does not scale well to 50 + nodes.
All aboves nodes referred to, (or are referred from) current nodes; Edges from Self to other have been omitted (or all nodes would be connected to the central node "self" which is not useful). Nodes are colored by the library they belong to, and scaled with the number of references pointing them