Voronoi(points, furthest_site=False, incremental=False, qhull_options=None)Coordinates of input points.
Coordinates of the Voronoi vertices.
Indices of the points between which each Voronoi ridge lies.
Indices of the Voronoi vertices forming each Voronoi ridge.
Indices of the Voronoi vertices forming each Voronoi region. -1 indicates vertex outside the Voronoi diagram.
Index of the Voronoi region for each input point. If qhull option "Qc" was not specified, the list will contain -1 for points that are not associated with a Voronoi region.
True if this was a furthest site triangulation and False if not.
The Voronoi diagram is computed using the Qhull library.
Coordinates of points to construct a Voronoi diagram from
Whether to compute a furthest-site Voronoi diagram. Default: False
Allow adding new points incrementally. This takes up some additional resources.
Additional options to pass to Qhull. See Qhull manual for details. (Default: "Qbb Qc Qz Qx" for ndim > 4 and "Qbb Qc Qz" otherwise. Incremental mode omits "Qz".)
Raised when Qhull encounters an error condition, such as geometrical degeneracy when options to resolve are not enabled.
Raised if an incompatible array is given as input.
Voronoi diagrams in N dimensions.
Voronoi diagram for a set of point:
>>> points = np.array([[0, 0], [0, 1], [0, 2], [1, 0], [1, 1], [1, 2],
...                    [2, 0], [2, 1], [2, 2]])
... from scipy.spatial import Voronoi, voronoi_plot_2d
... vor = Voronoi(points)
Plot it:
>>> import matplotlib.pyplot as plt
... fig = voronoi_plot_2d(vor)
... plt.show()
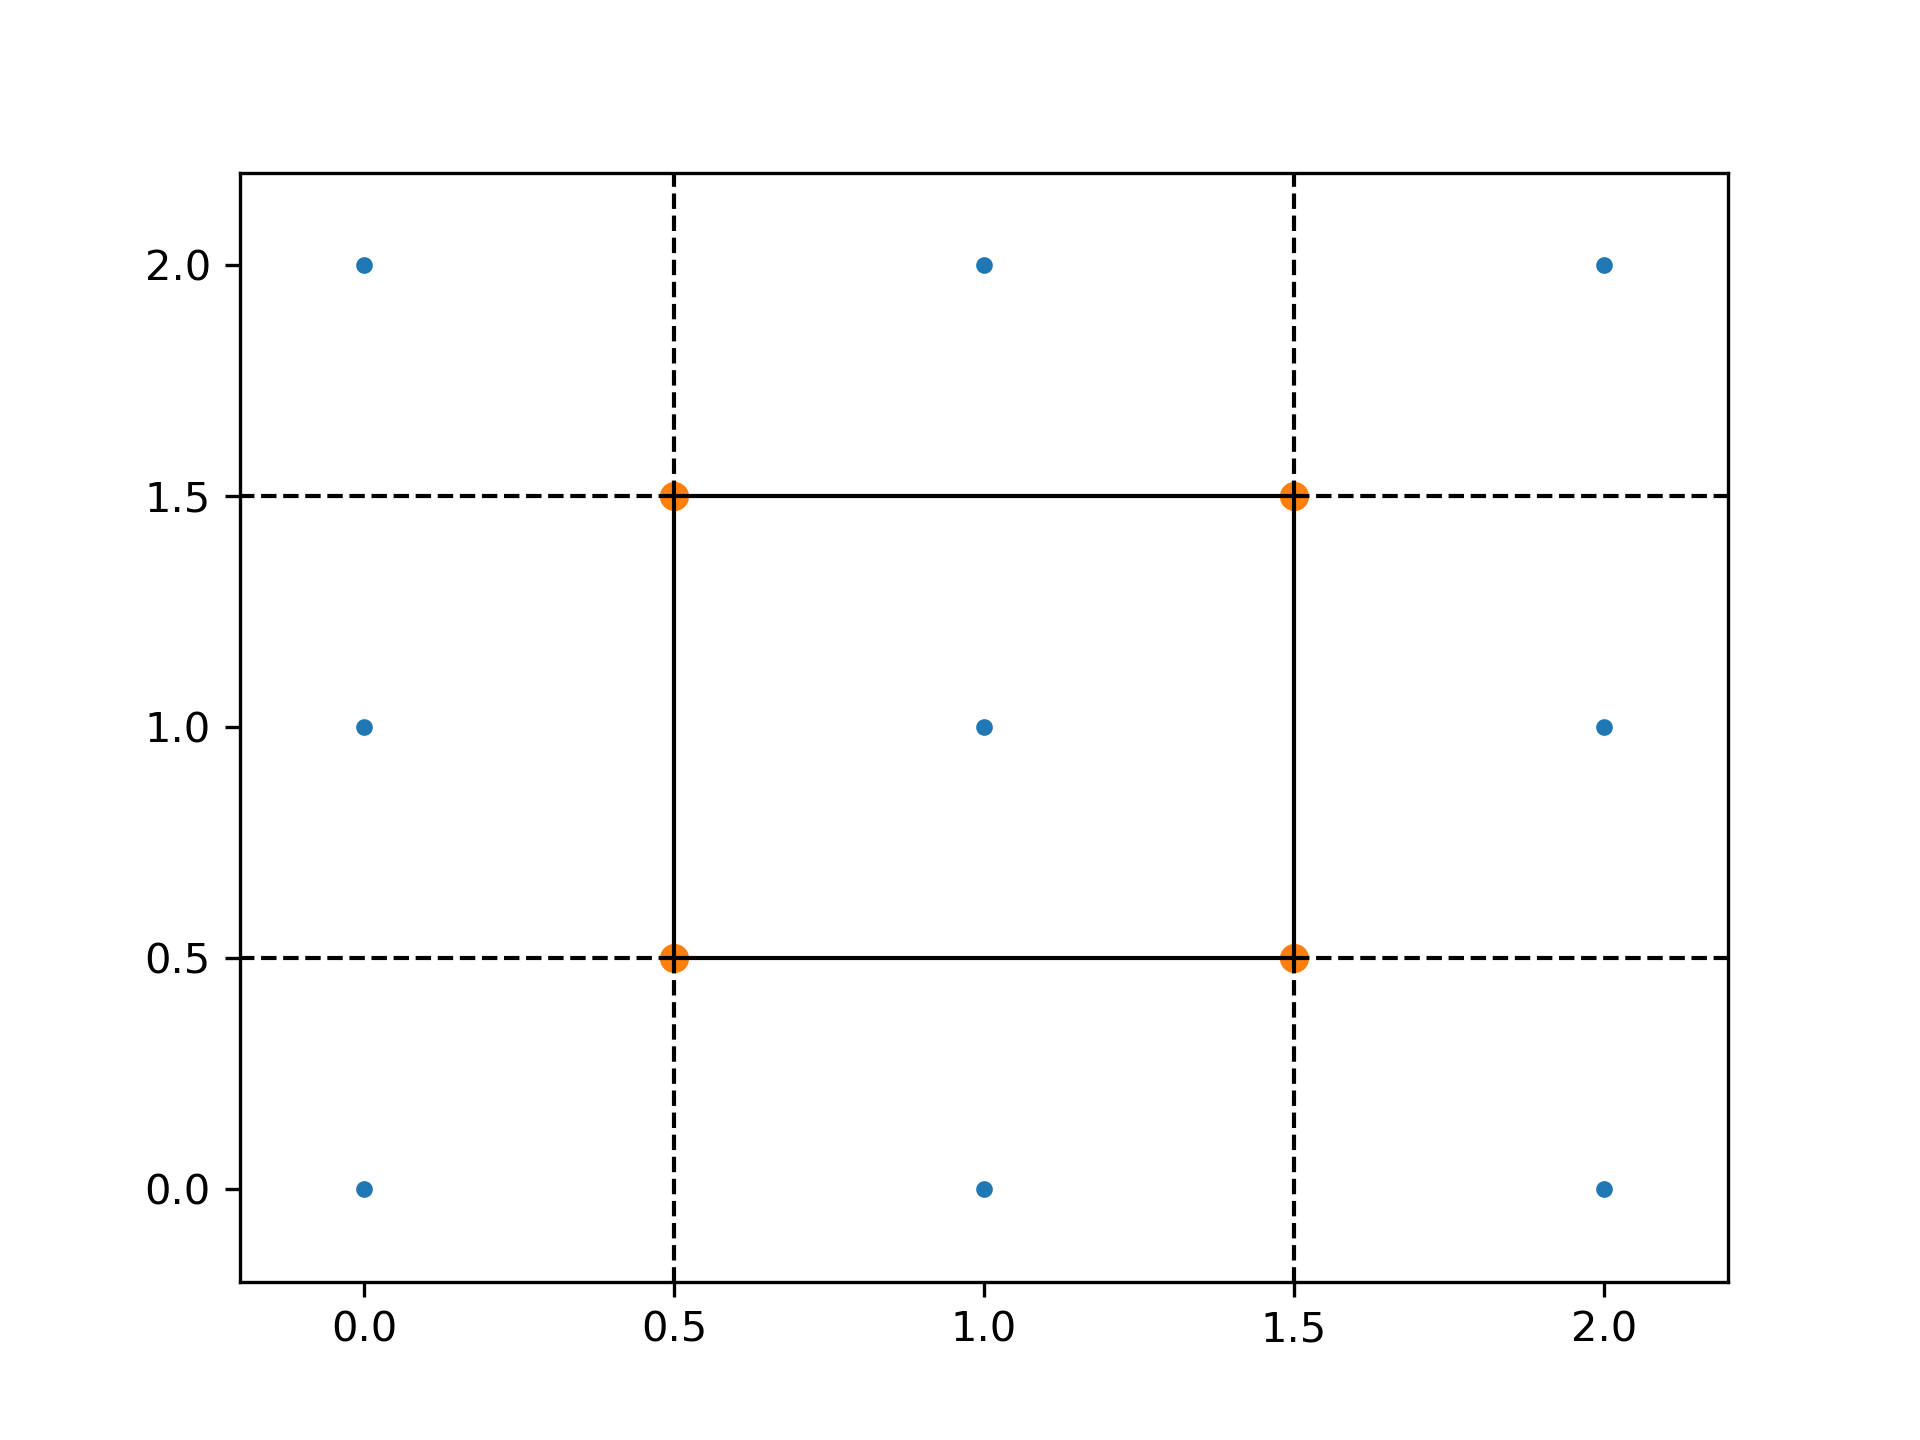
The Voronoi vertices:
>>> vor.vertices
array([[0.5, 0.5],
       [0.5, 1.5],
       [1.5, 0.5],
       [1.5, 1.5]])
There is a single finite Voronoi region, and four finite Voronoi ridges:
>>> vor.regions
[[], [-1, 0], [-1, 1], [1, -1, 0], [3, -1, 2], [-1, 3], [-1, 2], [0, 1, 3, 2], [2, -1, 0], [3, -1, 1]]
>>> vor.ridge_vertices
[[-1, 0], [-1, 0], [-1, 1], [-1, 1], [0, 1], [-1, 3], [-1, 2], [2, 3], [-1, 3], [-1, 2], [1, 3], [0, 2]]
The ridges are perpendicular between lines drawn between the following input points:
>>> vor.ridge_points
array([[0, 3],
       [0, 1],
       [2, 5],
       [2, 1],
       [1, 4],
       [7, 8],
       [7, 6],
       [7, 4],
       [8, 5],
       [6, 3],
       [4, 5],
       [4, 3]], dtype=int32)
See :
The following pages refer to to this document either explicitly or contain code examples using this.
scipy.spatial._qhull.Voronoi
scipy.spatial._plotutils.voronoi_plot_2d
Hover to see nodes names; edges to Self not shown, Caped at 50 nodes.
Using a canvas is more power efficient and can get hundred of nodes ; but does not allow hyperlinks; , arrows or text (beyond on hover)
SVG is more flexible but power hungry; and does not scale well to 50 + nodes.
All aboves nodes referred to, (or are referred from) current nodes; Edges from Self to other have been omitted (or all nodes would be connected to the central node "self" which is not useful). Nodes are colored by the library they belong to, and scaled with the number of references pointing them