morlet2(M, s, w=5)
Returns the complete version of morlet wavelet, normalised according to s:
exp(1j*w*x/s) * exp(-0.5*(x/s)**2) * pi**(-0.25) * sqrt(1/s)
This function was designed to work with cwt
. Because morlet2
returns an array of complex numbers, the :None:None:`dtype` argument of cwt
should be set to :None:None:`complex128` for best results.
Note the difference in implementation with morlet
. The fundamental frequency of this wavelet in Hz is given by:
f = w*fs / (2*s*np.pi)
where fs
is the sampling rate and s is the wavelet width parameter. Similarly we can get the wavelet width parameter at f
:
s = w*fs / (2*f*np.pi)
Length of the wavelet.
Width parameter of the wavelet.
Omega0. Default is 5
Complex Morlet wavelet, designed to work with cwt
.
morlet
Implementation of Morlet wavelet, incompatible with :None:None:`cwt`
>>> from scipy import signal
... import matplotlib.pyplot as plt
>>> M = 100
... s = 4.0
... w = 2.0
... wavelet = signal.morlet2(M, s, w)
... plt.plot(abs(wavelet))
... plt.show()
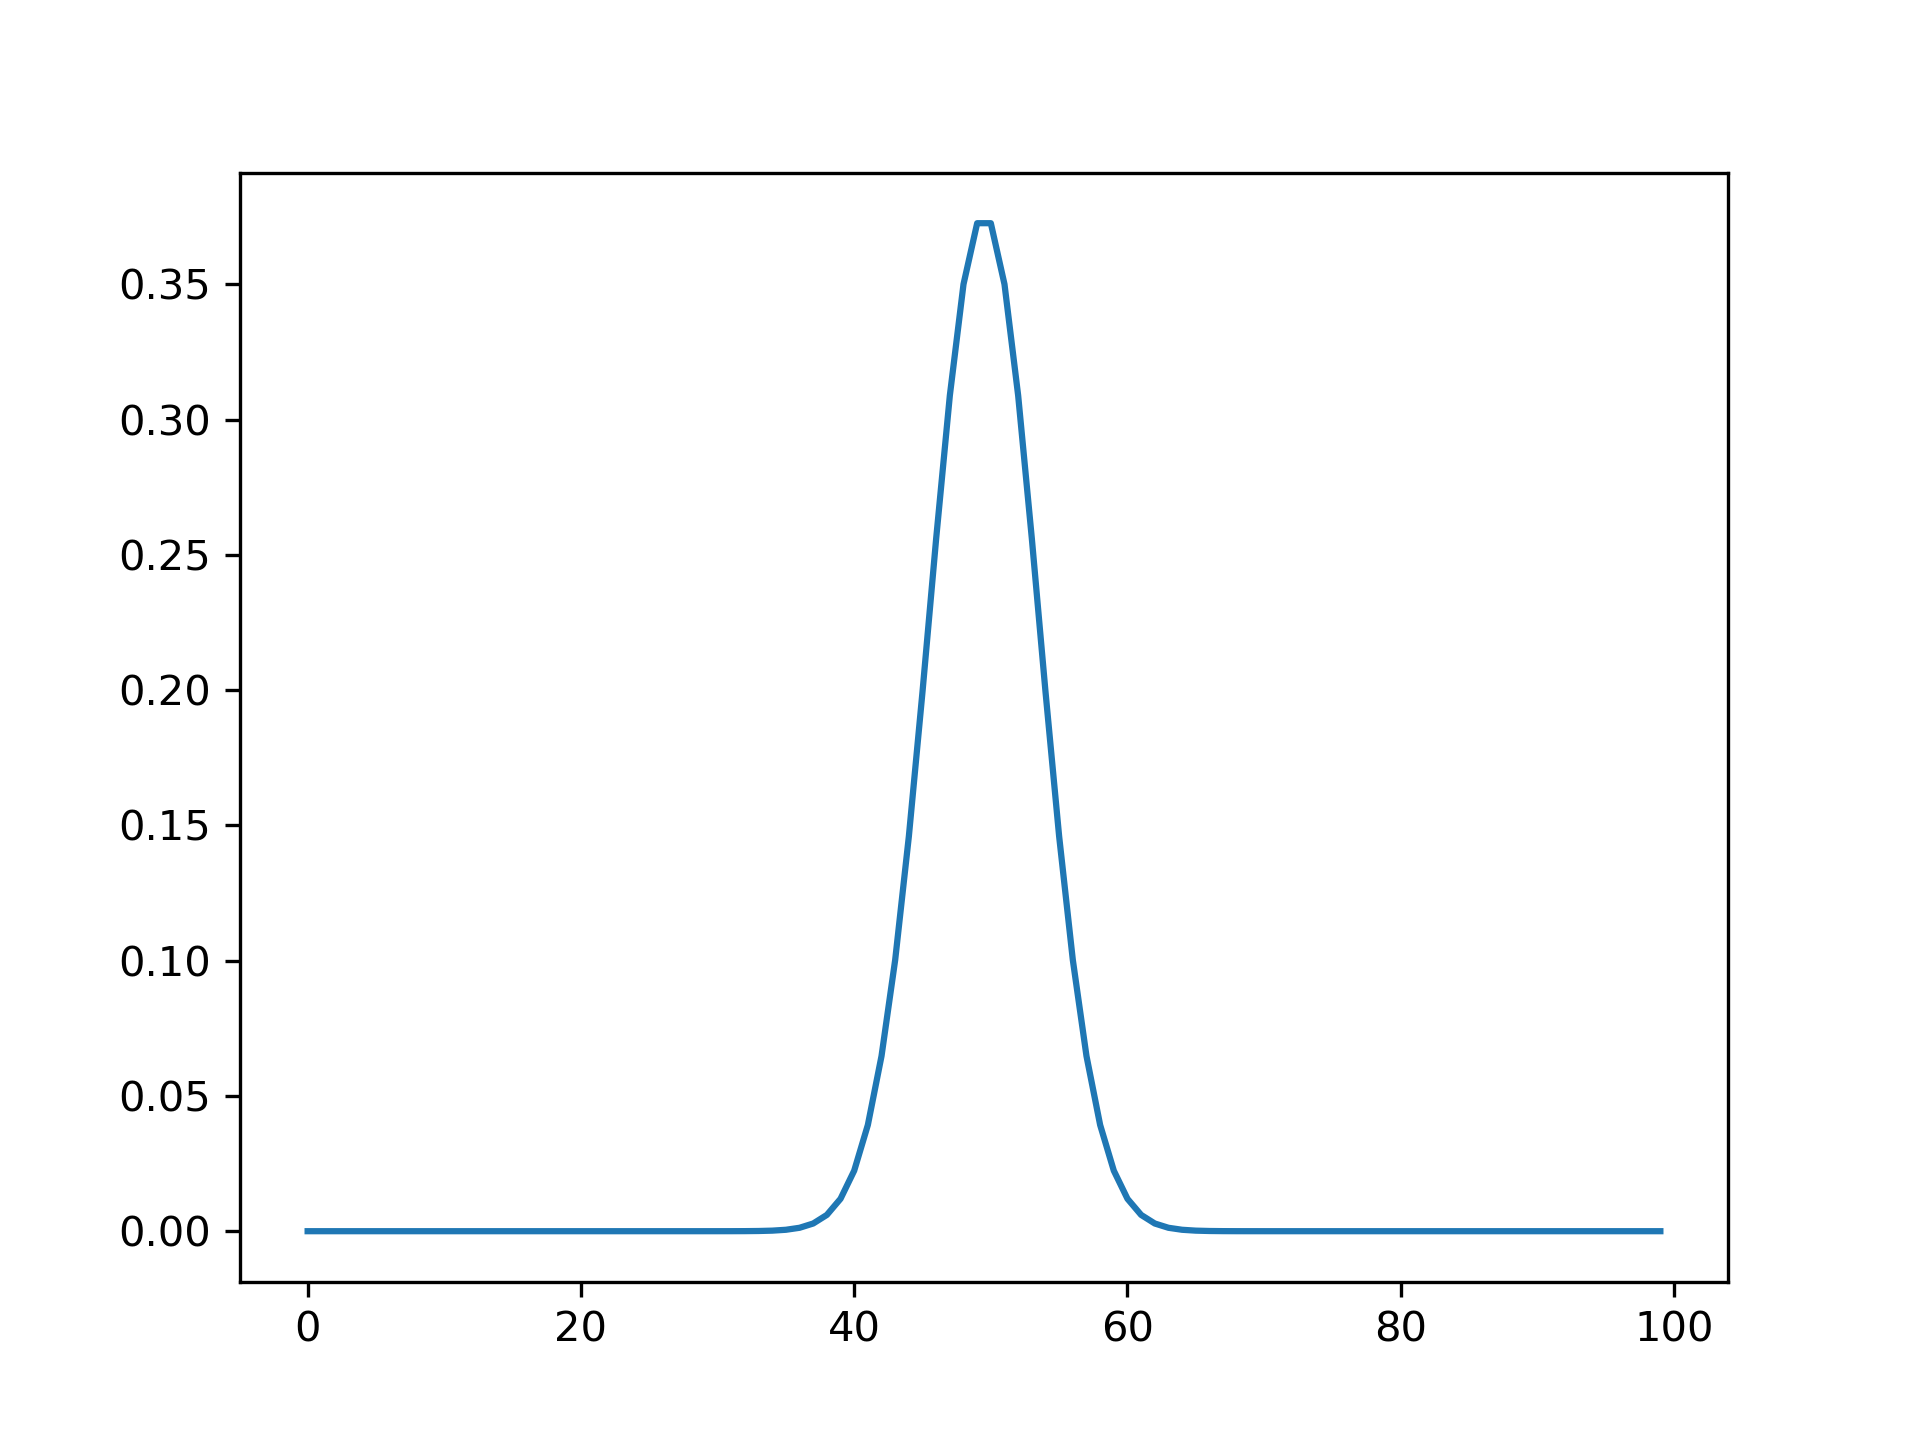
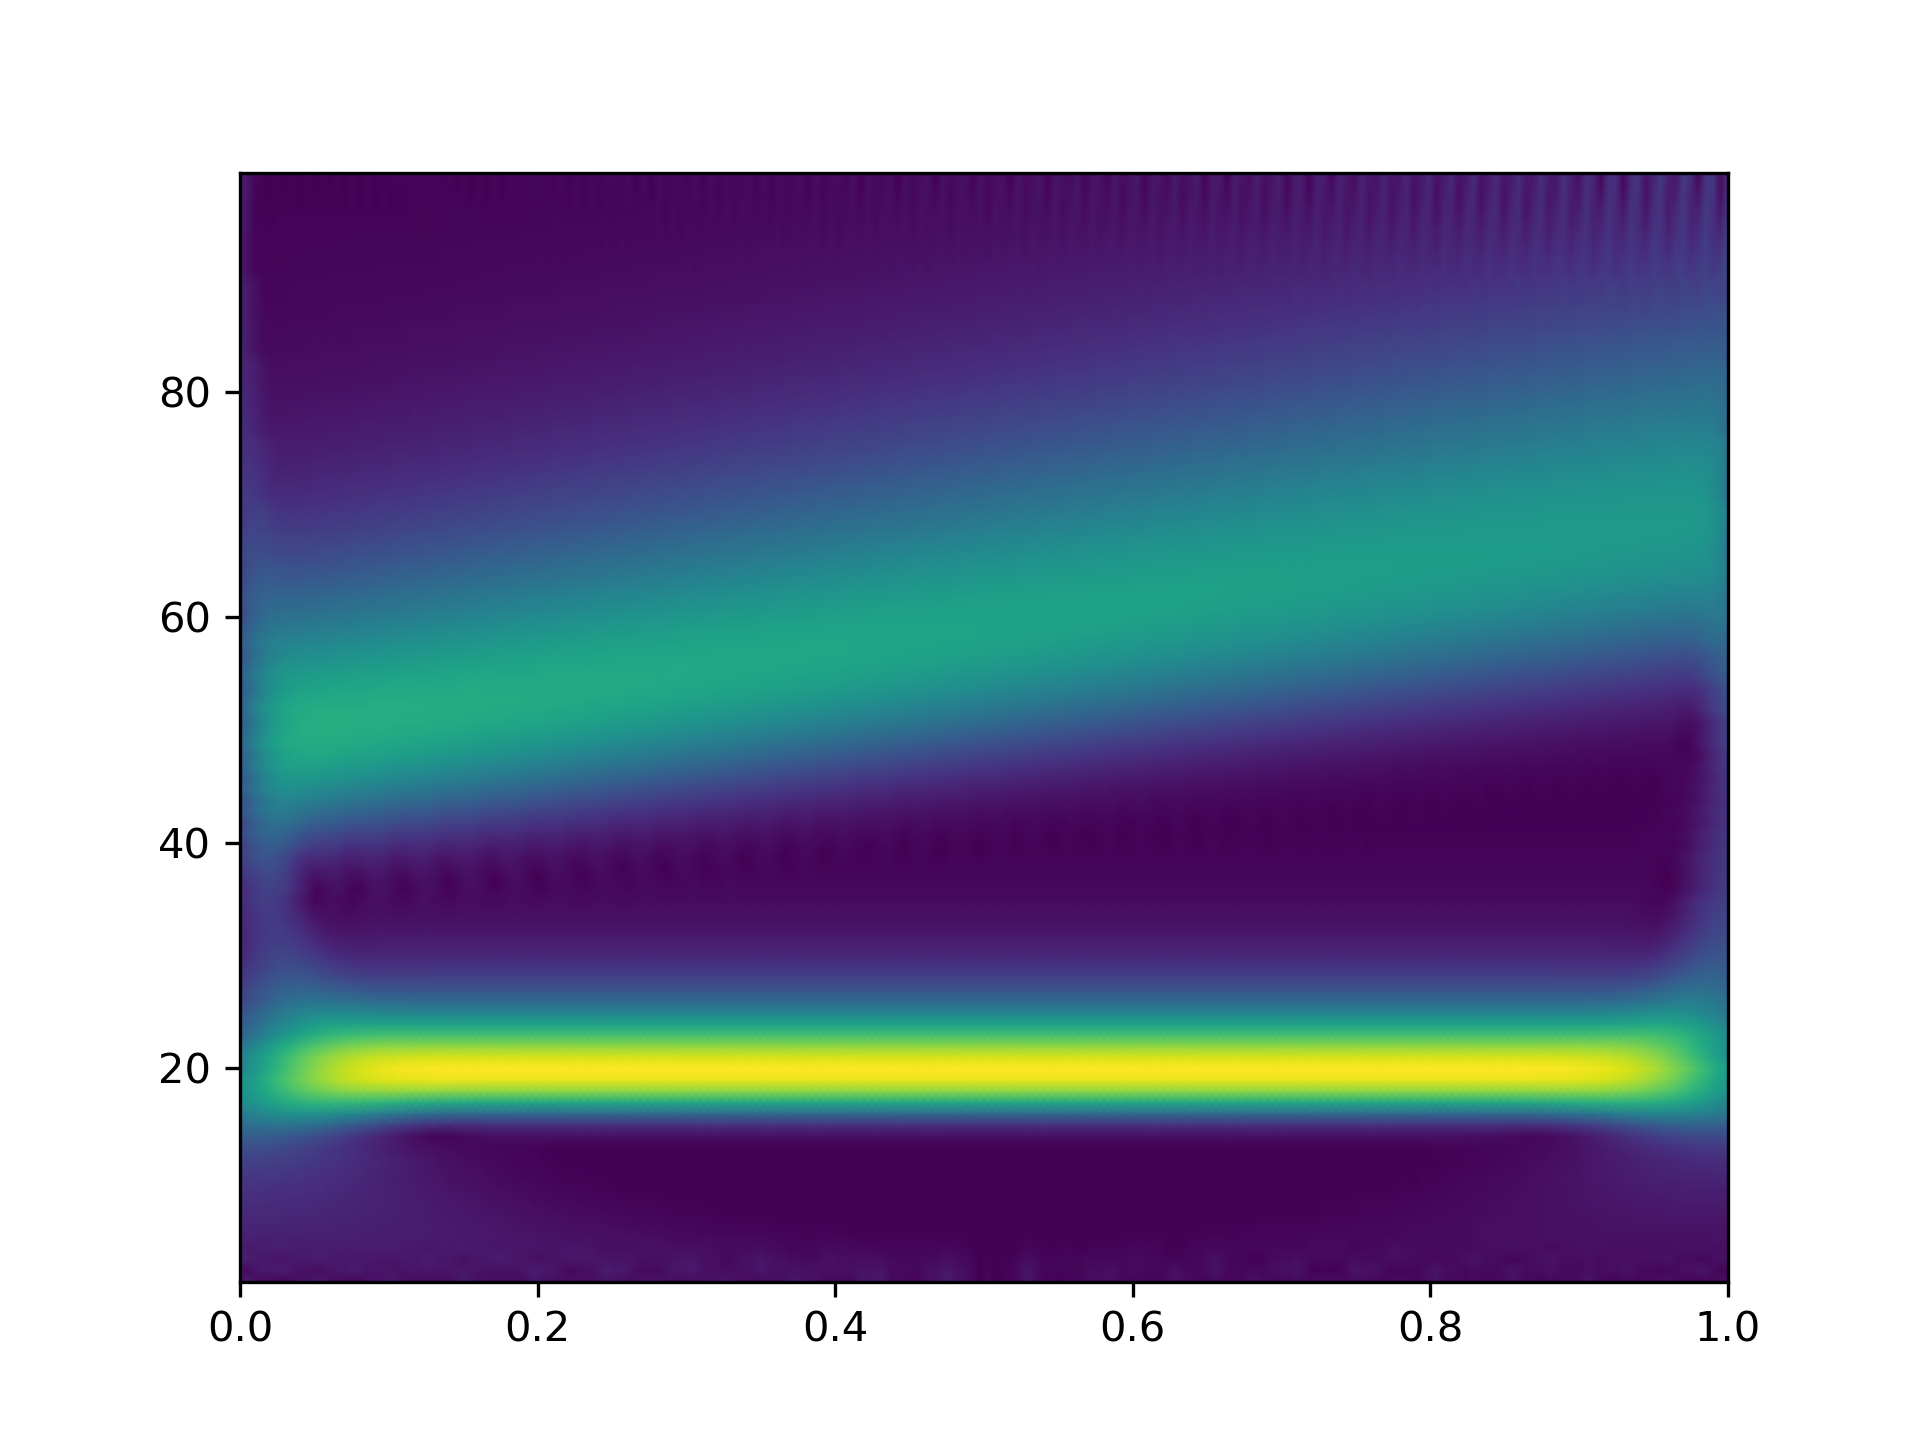
This example shows basic use of morlet2
with cwt
in time-frequency analysis:
>>> from scipy import signal
... import matplotlib.pyplot as plt
... t, dt = np.linspace(0, 1, 200, retstep=True)
... fs = 1/dt
... w = 6.
... sig = np.cos(2*np.pi*(50 + 10*t)*t) + np.sin(40*np.pi*t)
... freq = np.linspace(1, fs/2, 100)
... widths = w*fs / (2*freq*np.pi)
... cwtm = signal.cwt(sig, signal.morlet2, widths, w=w)
... plt.pcolormesh(t, freq, np.abs(cwtm), cmap='viridis', shading='gouraud')
... plt.show()
The following pages refer to to this document either explicitly or contain code examples using this.
scipy.signal._wavelets.morlet
scipy.signal._wavelets.morlet2
Hover to see nodes names; edges to Self not shown, Caped at 50 nodes.
Using a canvas is more power efficient and can get hundred of nodes ; but does not allow hyperlinks; , arrows or text (beyond on hover)
SVG is more flexible but power hungry; and does not scale well to 50 + nodes.
All aboves nodes referred to, (or are referred from) current nodes; Edges from Self to other have been omitted (or all nodes would be connected to the central node "self" which is not useful). Nodes are colored by the library they belong to, and scaled with the number of references pointing them