bracket(func, xa=0.0, xb=1.0, args=(), grow_limit=110.0, maxiter=1000)
Given a function and distinct initial points, search in the downhill direction (as defined by the initial points) and return new points xa, xb, xc that bracket the minimum of the function f(xa) > f(xb) < f(xc). It doesn't always mean that obtained solution will satisfy xa<=x<=xb.
Objective function to minimize.
Bracketing interval. Defaults :None:None:`xa` to 0.0, and :None:None:`xb` to 1.0.
Additional arguments (if present), passed to :None:None:`func`.
Maximum grow limit. Defaults to 110.0
Maximum number of iterations to perform. Defaults to 1000.
Bracket.
Objective function values in bracket.
Number of function evaluations made.
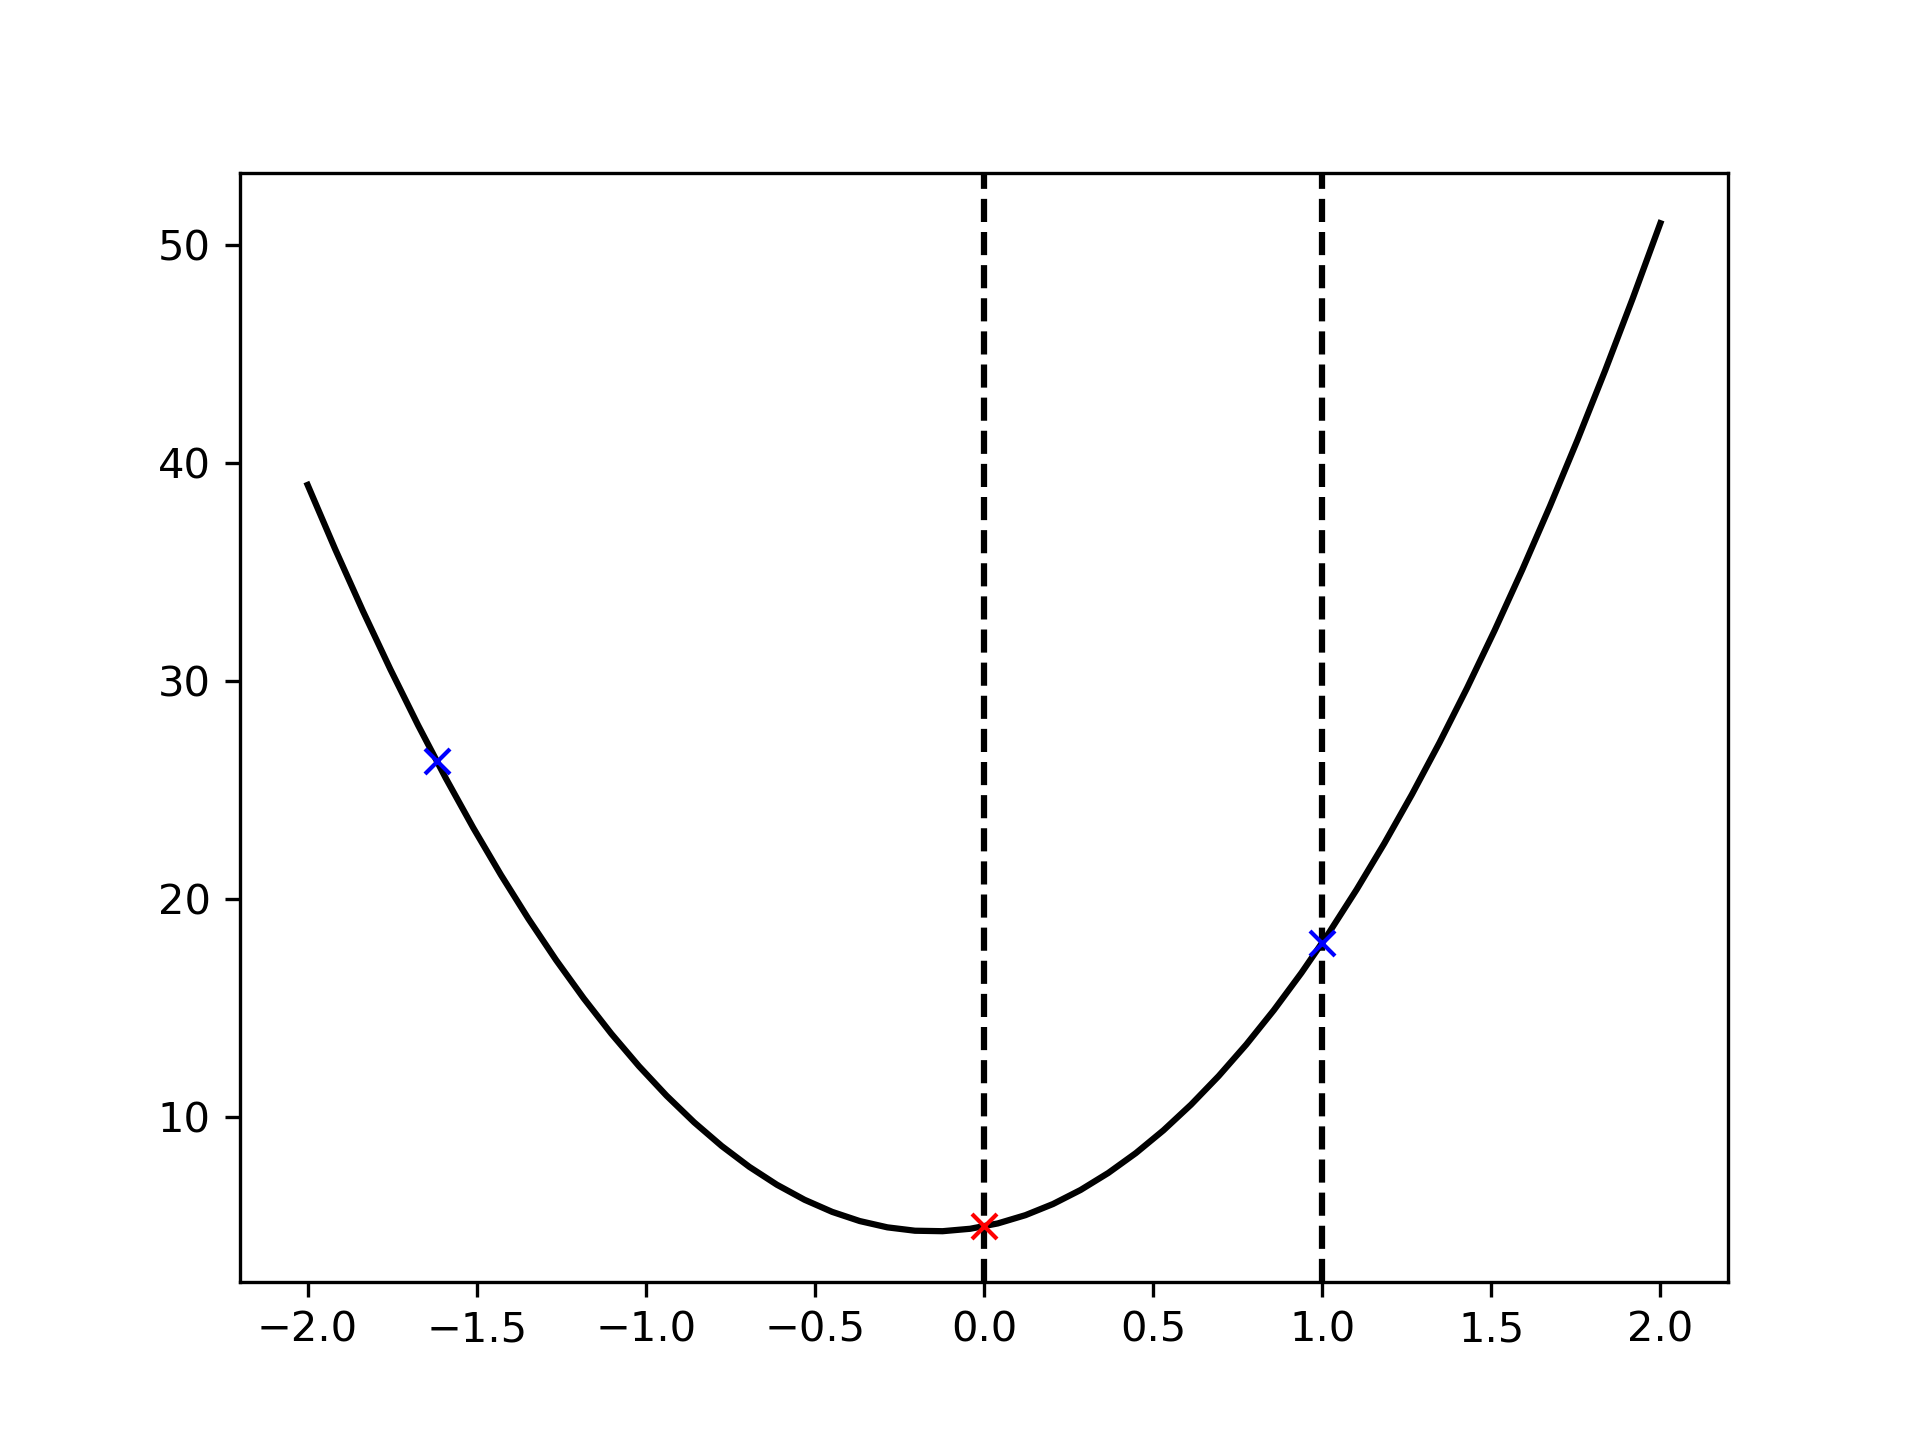
Bracket the minimum of the function.
This function can find a downward convex region of a function:
>>> import matplotlib.pyplot as plt
... from scipy.optimize import bracket
... def f(x):
...     return 10*x**2 + 3*x + 5
... x = np.linspace(-2, 2)
... y = f(x)
... init_xa, init_xb = 0, 1
... xa, xb, xc, fa, fb, fc, funcalls = bracket(f, xa=init_xa, xb=init_xb)
... plt.axvline(x=init_xa, color="k", linestyle="--")
... plt.axvline(x=init_xb, color="k", linestyle="--")
... plt.plot(x, y, "-k")
... plt.plot(xa, fa, "bx")
... plt.plot(xb, fb, "rx")
... plt.plot(xc, fc, "bx")
... plt.show()
The following pages refer to to this document either explicitly or contain code examples using this.
scipy.optimize._optimize.bracket
scipy.optimize._minimize.minimize_scalar
scipy.optimize._optimize.golden
Hover to see nodes names; edges to Self not shown, Caped at 50 nodes.
Using a canvas is more power efficient and can get hundred of nodes ; but does not allow hyperlinks; , arrows or text (beyond on hover)
SVG is more flexible but power hungry; and does not scale well to 50 + nodes.
All aboves nodes referred to, (or are referred from) current nodes; Edges from Self to other have been omitted (or all nodes would be connected to the central node "self" which is not useful). Nodes are colored by the library they belong to, and scaled with the number of references pointing them