pchip_interpolate(xi, yi, x, der=0, axis=0)
xi and yi are arrays of values used to approximate some function f, with yi = f(xi)
. The interpolant uses monotonic cubic splines to find the value of new points x and the derivatives there.
See scipy.interpolate.PchipInterpolator
for details.
A sorted list of x-coordinates, of length N.
A 1-D array of real values. :None:None:`yi`'s length along the interpolation axis must be equal to the length of :None:None:`xi`. If N-D array, use axis parameter to select correct axis.
Of length M.
Derivatives to extract. The 0th derivative can be included to return the function value.
Axis in the yi array corresponding to the x-coordinate values.
The result, of length R or length M or M by R,
Convenience function for pchip interpolation.
PchipInterpolator
PCHIP 1-D monotonic cubic interpolator.
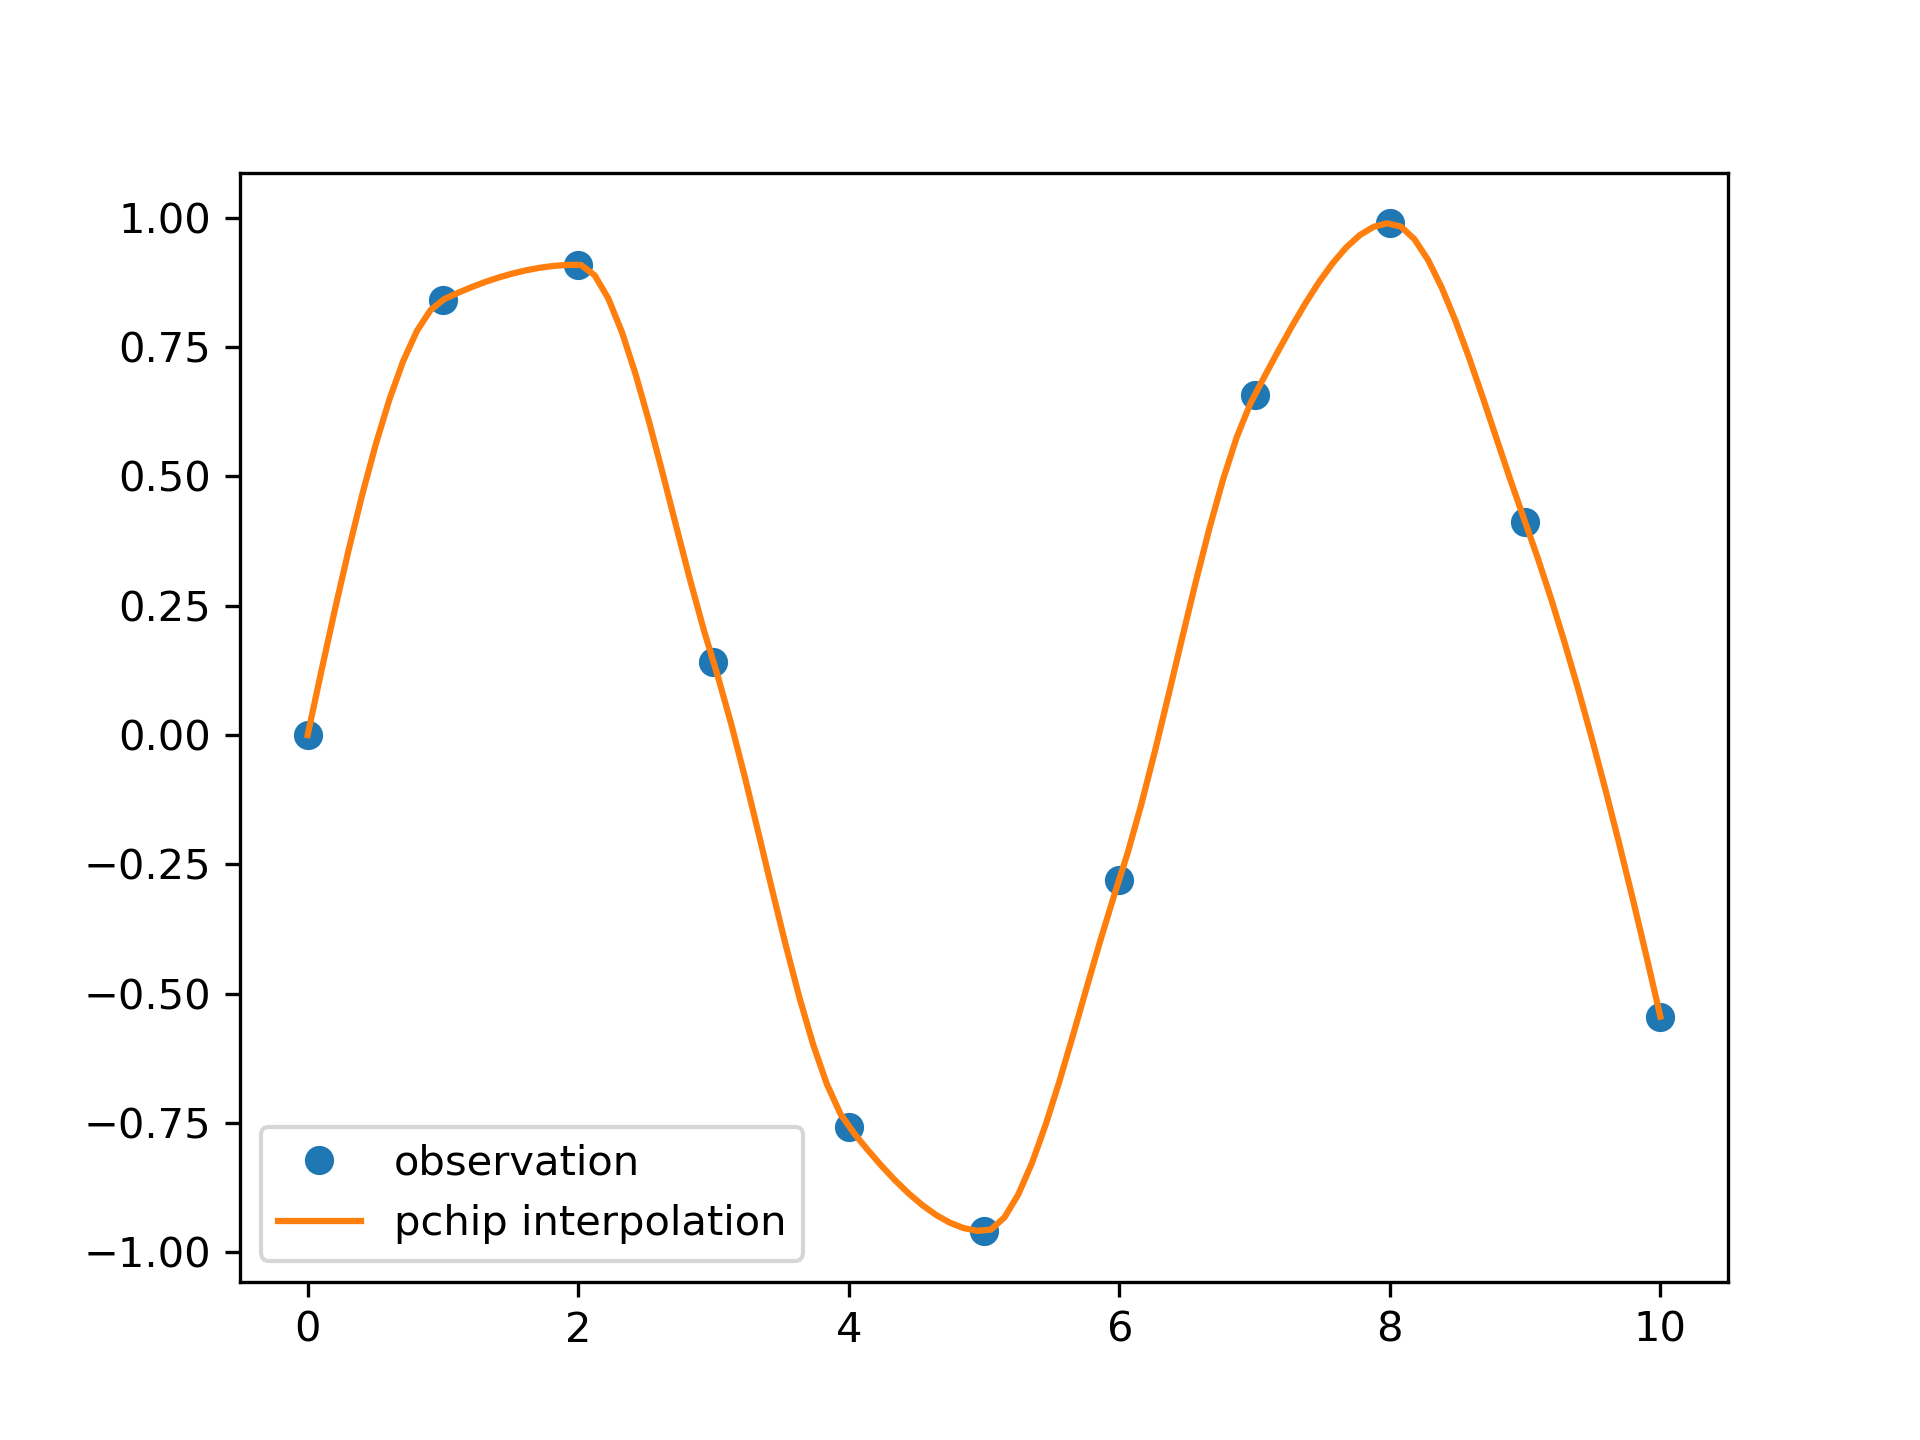
We can interpolate 2D observed data using pchip interpolation:
>>> import matplotlib.pyplot as plt
... from scipy.interpolate import pchip_interpolate
... x_observed = np.linspace(0.0, 10.0, 11)
... y_observed = np.sin(x_observed)
... x = np.linspace(min(x_observed), max(x_observed), num=100)
... y = pchip_interpolate(x_observed, y_observed, x)
... plt.plot(x_observed, y_observed, "o", label="observation")
... plt.plot(x, y, label="pchip interpolation")
... plt.legend()
... plt.show()
The following pages refer to to this document either explicitly or contain code examples using this.
scipy.interpolate._cubic.pchip_interpolate
Hover to see nodes names; edges to Self not shown, Caped at 50 nodes.
Using a canvas is more power efficient and can get hundred of nodes ; but does not allow hyperlinks; , arrows or text (beyond on hover)
SVG is more flexible but power hungry; and does not scale well to 50 + nodes.
All aboves nodes referred to, (or are referred from) current nodes; Edges from Self to other have been omitted (or all nodes would be connected to the central node "self" which is not useful). Nodes are colored by the library they belong to, and scaled with the number of references pointing them