HalfspaceIntersection(halfspaces, interior_point, incremental=False, qhull_options=None)Input halfspaces.
Input interior point.
Intersections of all halfspaces.
Dual points of the input halfspaces.
Indices of points forming the (non necessarily simplicial) facets of the dual convex hull.
Indices of halfspaces forming the vertices of the dual convex hull. For 2-D convex hulls, the vertices are in counterclockwise order. For other dimensions, they are in input order.
[normal, offset] forming the hyperplane equation of the dual facet (see Qhull documentation for more).
Area of the dual convex hull
Volume of the dual convex hull
The intersections are computed using the Qhull library. This reproduces the "qhalf" functionality of Qhull.
Stacked Inequalities of the form Ax + b <= 0 in format [A; b]
Point clearly inside the region defined by halfspaces. Also called a feasible point, it can be obtained by linear programming.
Allow adding new halfspaces incrementally. This takes up some additional resources.
Additional options to pass to Qhull. See Qhull manual for details. (Default: "Qx" for ndim > 4 and "" otherwise) Option "H" is always enabled.
Raised when Qhull encounters an error condition, such as geometrical degeneracy when options to resolve are not enabled.
Raised if an incompatible array is given as input.
Halfspace intersections in N dimensions.
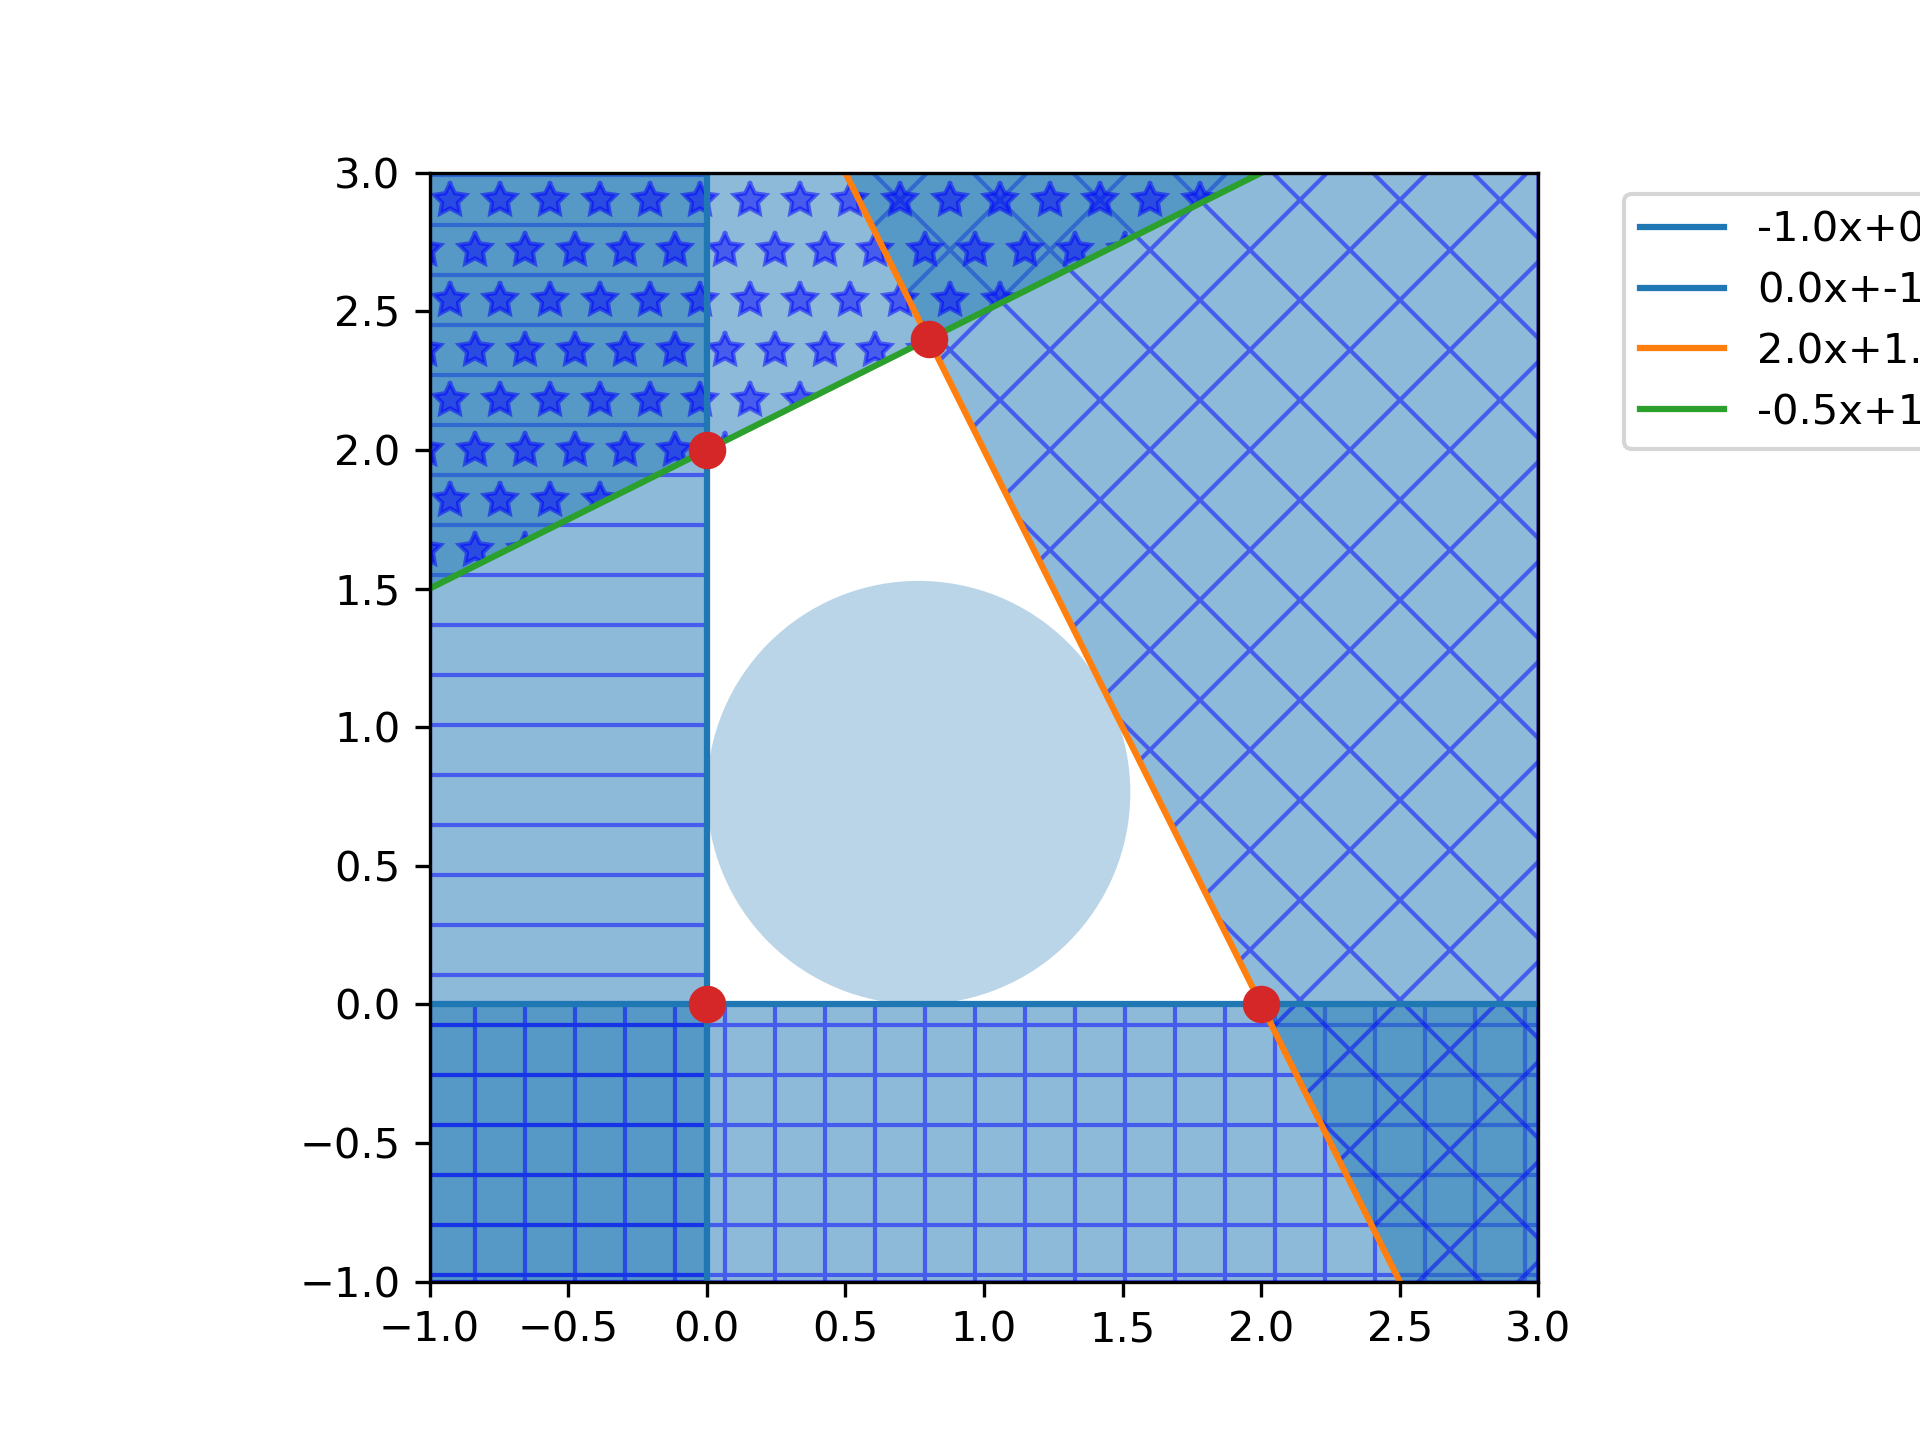
Halfspace intersection of planes forming some polygon
>>> from scipy.spatial import HalfspaceIntersection
... halfspaces = np.array([[-1, 0., 0.],
...                        [0., -1., 0.],
...                        [2., 1., -4.],
...                        [-0.5, 1., -2.]])
... feasible_point = np.array([0.5, 0.5])
... hs = HalfspaceIntersection(halfspaces, feasible_point)
Plot halfspaces as filled regions and intersection points:
>>> import matplotlib.pyplot as plt
... fig = plt.figure()
... ax = fig.add_subplot(1, 1, 1, aspect='equal')
... xlim, ylim = (-1, 3), (-1, 3)
... ax.set_xlim(xlim)
... ax.set_ylim(ylim)
... x = np.linspace(-1, 3, 100)
... symbols = ['-', '+', 'x', '*']
... signs = [0, 0, -1, -1]
... fmt = {"color": None, "edgecolor": "b", "alpha": 0.5}
... for h, sym, sign in zip(halfspaces, symbols, signs):
...     hlist = h.tolist()
...     fmt["hatch"] = sym
...     if h[1]== 0:
...         ax.axvline(-h[2]/h[0], label='{}x+{}y+{}=0'.format(*hlist))
...         xi = np.linspace(xlim[sign], -h[2]/h[0], 100)
...         ax.fill_between(xi, ylim[0], ylim[1], **fmt)
...     else:
...         ax.plot(x, (-h[2]-h[0]*x)/h[1], label='{}x+{}y+{}=0'.format(*hlist))
...         ax.fill_between(x, (-h[2]-h[0]*x)/h[1], ylim[sign], **fmt)
... x, y = zip(*hs.intersections)
... ax.plot(x, y, 'o', markersize=8)
By default, qhull does not provide with a way to compute an interior point. This can easily be computed using linear programming. Considering halfspaces of the form $Ax + b \leq 0$ , solving the linear program:
$$$$max \: y
s.t. Ax + y
<SubstitutionRef:
   |value: '||A_i||'
   |>
\leq -b
With $A_i$ being the rows of A, i.e. the normals to each plane.
Will yield a point x that is furthest inside the convex polyhedron. To be precise, it is the center of the largest hypersphere of radius y inscribed in the polyhedron. This point is called the Chebyshev center of the polyhedron (see 4.3.1, pp148-149). The equations outputted by Qhull are always normalized.
>>> from scipy.optimize import linprog
... from matplotlib.patches import Circle
... norm_vector = np.reshape(np.linalg.norm(halfspaces[:, :-1], axis=1),
...     (halfspaces.shape[0], 1))
... c = np.zeros((halfspaces.shape[1],))
... c[-1] = -1
... A = np.hstack((halfspaces[:, :-1], norm_vector))
... b = - halfspaces[:, -1:]
... res = linprog(c, A_ub=A, b_ub=b, bounds=(None, None))
... x = res.x[:-1]
... y = res.x[-1]
... circle = Circle(x, radius=y, alpha=0.3)
... ax.add_patch(circle)
... plt.legend(bbox_to_anchor=(1.6, 1.0))
... plt.show()
The following pages refer to to this document either explicitly or contain code examples using this.
scipy.spatial._qhull.HalfspaceIntersection
Hover to see nodes names; edges to Self not shown, Caped at 50 nodes.
Using a canvas is more power efficient and can get hundred of nodes ; but does not allow hyperlinks; , arrows or text (beyond on hover)
SVG is more flexible but power hungry; and does not scale well to 50 + nodes.
All aboves nodes referred to, (or are referred from) current nodes; Edges from Self to other have been omitted (or all nodes would be connected to the central node "self" which is not useful). Nodes are colored by the library they belong to, and scaled with the number of references pointing them