cwt(data, wavelet, widths, dtype=None, **kwargs)
Performs a continuous wavelet transform on data
, using the :None:None:`wavelet` function. A CWT performs a convolution with data
using the :None:None:`wavelet` function, which is characterized by a width parameter and length parameter. The :None:None:`wavelet` function is allowed to be complex.
For non-symmetric, complex-valued wavelets, the input signal is convolved with the time-reversed complex-conjugate of the wavelet data [1].
length = min(10 * width[ii], len(data))
cwt[ii,:] = signal.convolve(data, np.conj(wavelet(length, width[ii],
                                **kwargs))[::-1], mode='same')
data on which to perform the transform.
Wavelet function, which should take 2 arguments. The first argument is the number of points that the returned vector will have (len(wavelet(length,width)) == length). The second is a width parameter, defining the size of the wavelet (e.g. standard deviation of a gaussian). See ricker
, which satisfies these requirements.
Widths to use for transform.
The desired data type of output. Defaults to float64
if the output of :None:None:`wavelet` is real and complex128
if it is complex.
Keyword arguments passed to wavelet function.
Will have shape of (len(widths), len(data)).
Continuous wavelet transform.
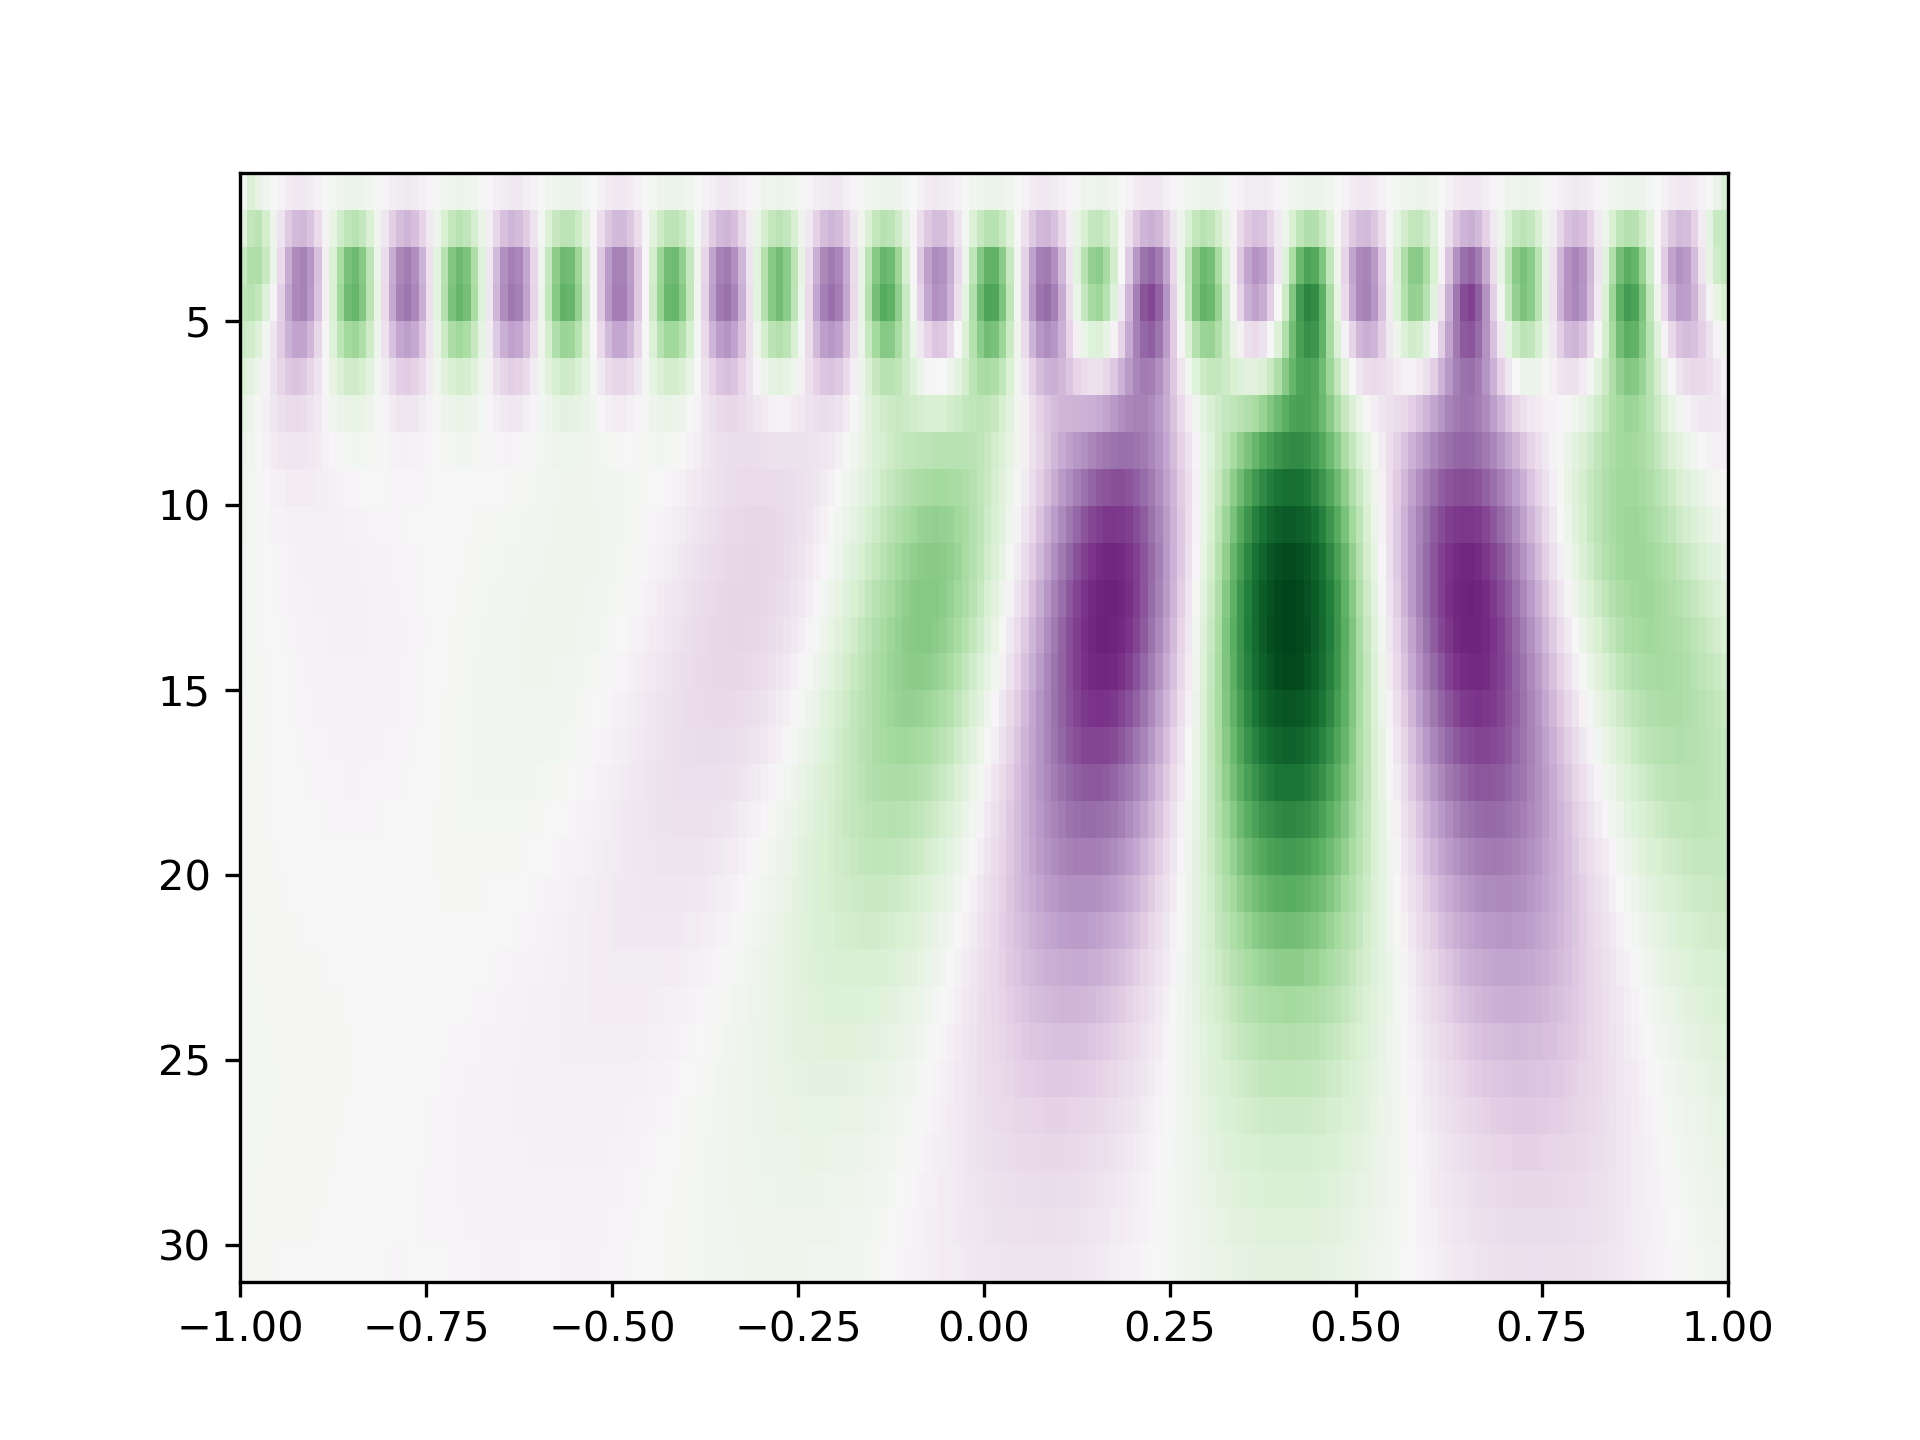
>>> from scipy import signal
... import matplotlib.pyplot as plt
... t = np.linspace(-1, 1, 200, endpoint=False)
... sig  = np.cos(2 * np.pi * 7 * t) + signal.gausspulse(t - 0.4, fc=2)
... widths = np.arange(1, 31)
... cwtmatr = signal.cwt(sig, signal.ricker, widths)
... plt.imshow(cwtmatr, extent=[-1, 1, 31, 1], cmap='PRGn', aspect='auto',
...            vmax=abs(cwtmatr).max(), vmin=-abs(cwtmatr).max())
... plt.show()
The following pages refer to to this document either explicitly or contain code examples using this.
scipy.signal._wavelets.morlet
scipy.signal._wavelets.cwt
scipy.signal._peak_finding.find_peaks_cwt
scipy.signal._wavelets.morlet2
Hover to see nodes names; edges to Self not shown, Caped at 50 nodes.
Using a canvas is more power efficient and can get hundred of nodes ; but does not allow hyperlinks; , arrows or text (beyond on hover)
SVG is more flexible but power hungry; and does not scale well to 50 + nodes.
All aboves nodes referred to, (or are referred from) current nodes; Edges from Self to other have been omitted (or all nodes would be connected to the central node "self" which is not useful). Nodes are colored by the library they belong to, and scaled with the number of references pointing them