query_ball_point(self, x, r, p=2.0, eps=0, workers=1, return_sorted=None, return_length=False)
If you have many points whose neighbors you want to find, you may save substantial amounts of time by putting them in a KDTree and using query_ball_tree.
The point or points to search for neighbors of.
The radius of points to return, must broadcast to the length of x.
Which Minkowski p-norm to use. Should be in the range [1, inf]. A finite large p may cause a ValueError if overflow can occur.
Approximate search. Branches of the tree are not explored if their nearest points are further than r / (1 + eps)
, and branches are added in bulk if their furthest points are nearer than r * (1 + eps)
.
Number of jobs to schedule for parallel processing. If -1 is given all processors are used. Default: 1.
Sorts returned indicies if True and does not sort them if False. If None, does not sort single point queries, but does sort multi-point queries which was the behavior before this option was added.
Return the number of points inside the radius instead of a list of the indices.
If x is a single point, returns a list of the indices of the neighbors of x. If x is an array of points, returns an object array of shape tuple containing lists of neighbors.
Find all points within distance r of point(s) x.
>>> from scipy import spatial
... x, y = np.mgrid[0:5, 0:5]
... points = np.c_[x.ravel(), y.ravel()]
... tree = spatial.KDTree(points)
... sorted(tree.query_ball_point([2, 0], 1))
[5, 10, 11, 15]
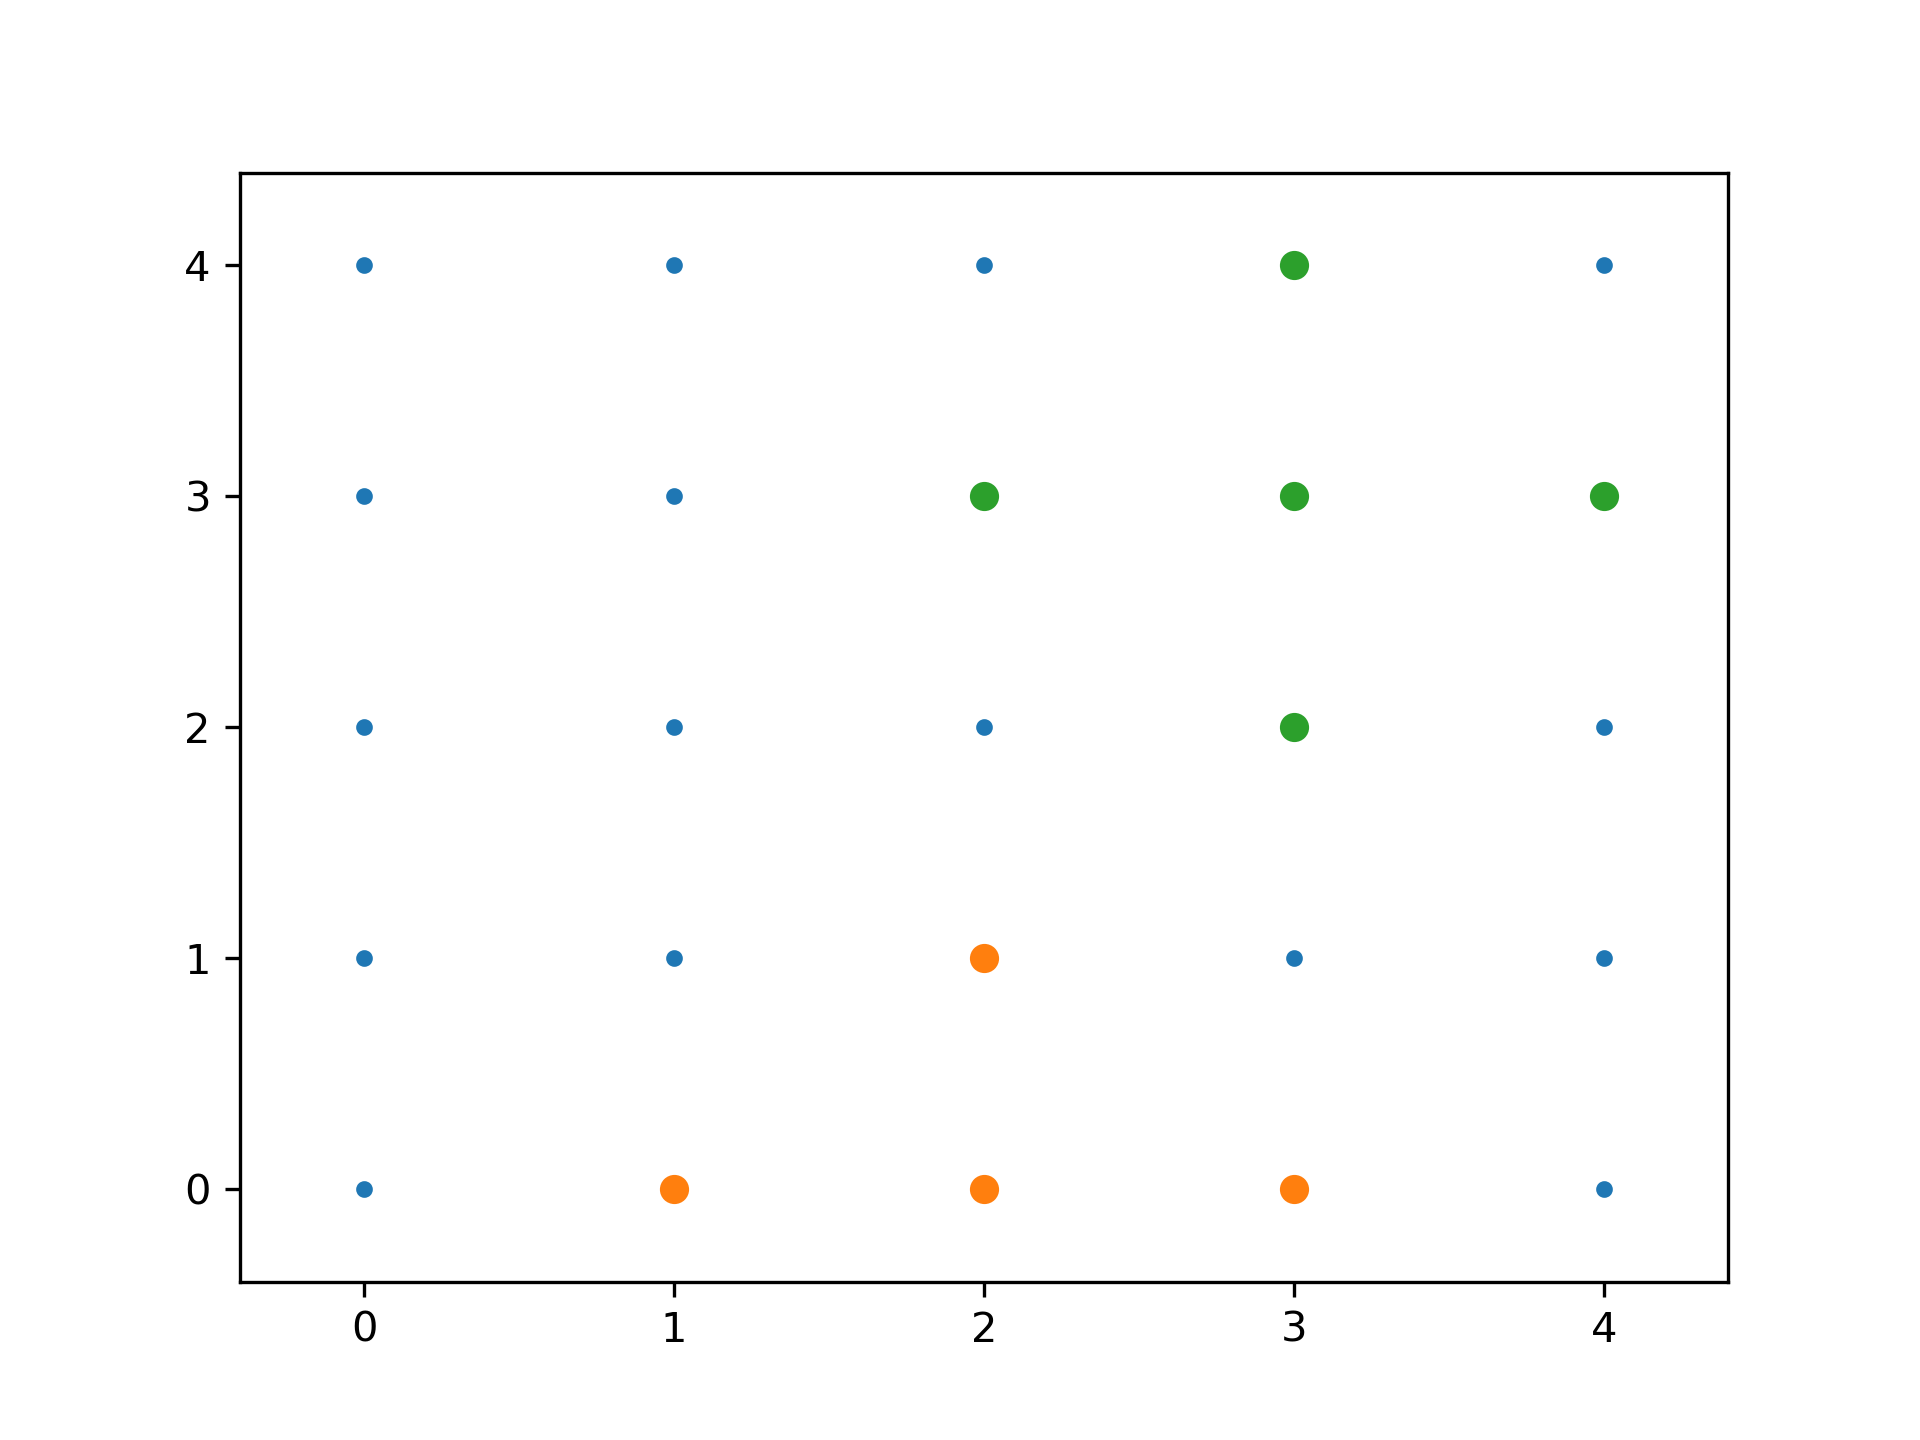
Query multiple points and plot the results:
>>> import matplotlib.pyplot as plt
... points = np.asarray(points)
... plt.plot(points[:,0], points[:,1], '.')
... for results in tree.query_ball_point(([2, 0], [3, 3]), 1):
...     nearby_points = points[results]
...     plt.plot(nearby_points[:,0], nearby_points[:,1], 'o')
... plt.margins(0.1, 0.1)
... plt.show()
The following pages refer to to this document either explicitly or contain code examples using this.
scipy.spatial._kdtree.KDTree.query_ball_point
Hover to see nodes names; edges to Self not shown, Caped at 50 nodes.
Using a canvas is more power efficient and can get hundred of nodes ; but does not allow hyperlinks; , arrows or text (beyond on hover)
SVG is more flexible but power hungry; and does not scale well to 50 + nodes.
All aboves nodes referred to, (or are referred from) current nodes; Edges from Self to other have been omitted (or all nodes would be connected to the central node "self" which is not useful). Nodes are colored by the library they belong to, and scaled with the number of references pointing them