lstsq(a, b, cond=None, overwrite_a=False, overwrite_b=False, check_finite=True, lapack_driver=None)
Compute a vector x such that the 2-norm |b - A x|
is minimized.
When 'gelsy'
is used as a driver, residues
is set to a (0,)-shaped array and s is always None
.
Left-hand side array
Right hand side array
Cutoff for 'small' singular values; used to determine effective rank of a. Singular values smaller than cond * largest_singular_value
are considered zero.
Discard data in a (may enhance performance). Default is False.
Discard data in b (may enhance performance). Default is False.
Whether to check that the input matrices contain only finite numbers. Disabling may give a performance gain, but may result in problems (crashes, non-termination) if the inputs do contain infinities or NaNs.
Which LAPACK driver is used to solve the least-squares problem. Options are 'gelsd'
, 'gelsy'
, 'gelss'
. Default ( 'gelsd'
) is a good choice. However, 'gelsy'
can be slightly faster on many problems. 'gelss'
was used historically. It is generally slow but uses less memory.
If computation does not converge.
When parameters are not compatible.
Least-squares solution.
Square of the 2-norm for each column in b - a x
, if M > N
and ndim(A) == n
(returns a scalar if b
is 1-D). Otherwise a (0,)-shaped array is returned.
Effective rank of a.
Singular values of a. The condition number of a
is s[0] / s[-1]
.
Compute least-squares solution to equation Ax = b.
scipy.optimize.nnls
linear least squares with non-negativity constraint
>>> from scipy.linalg import lstsq
... import matplotlib.pyplot as plt
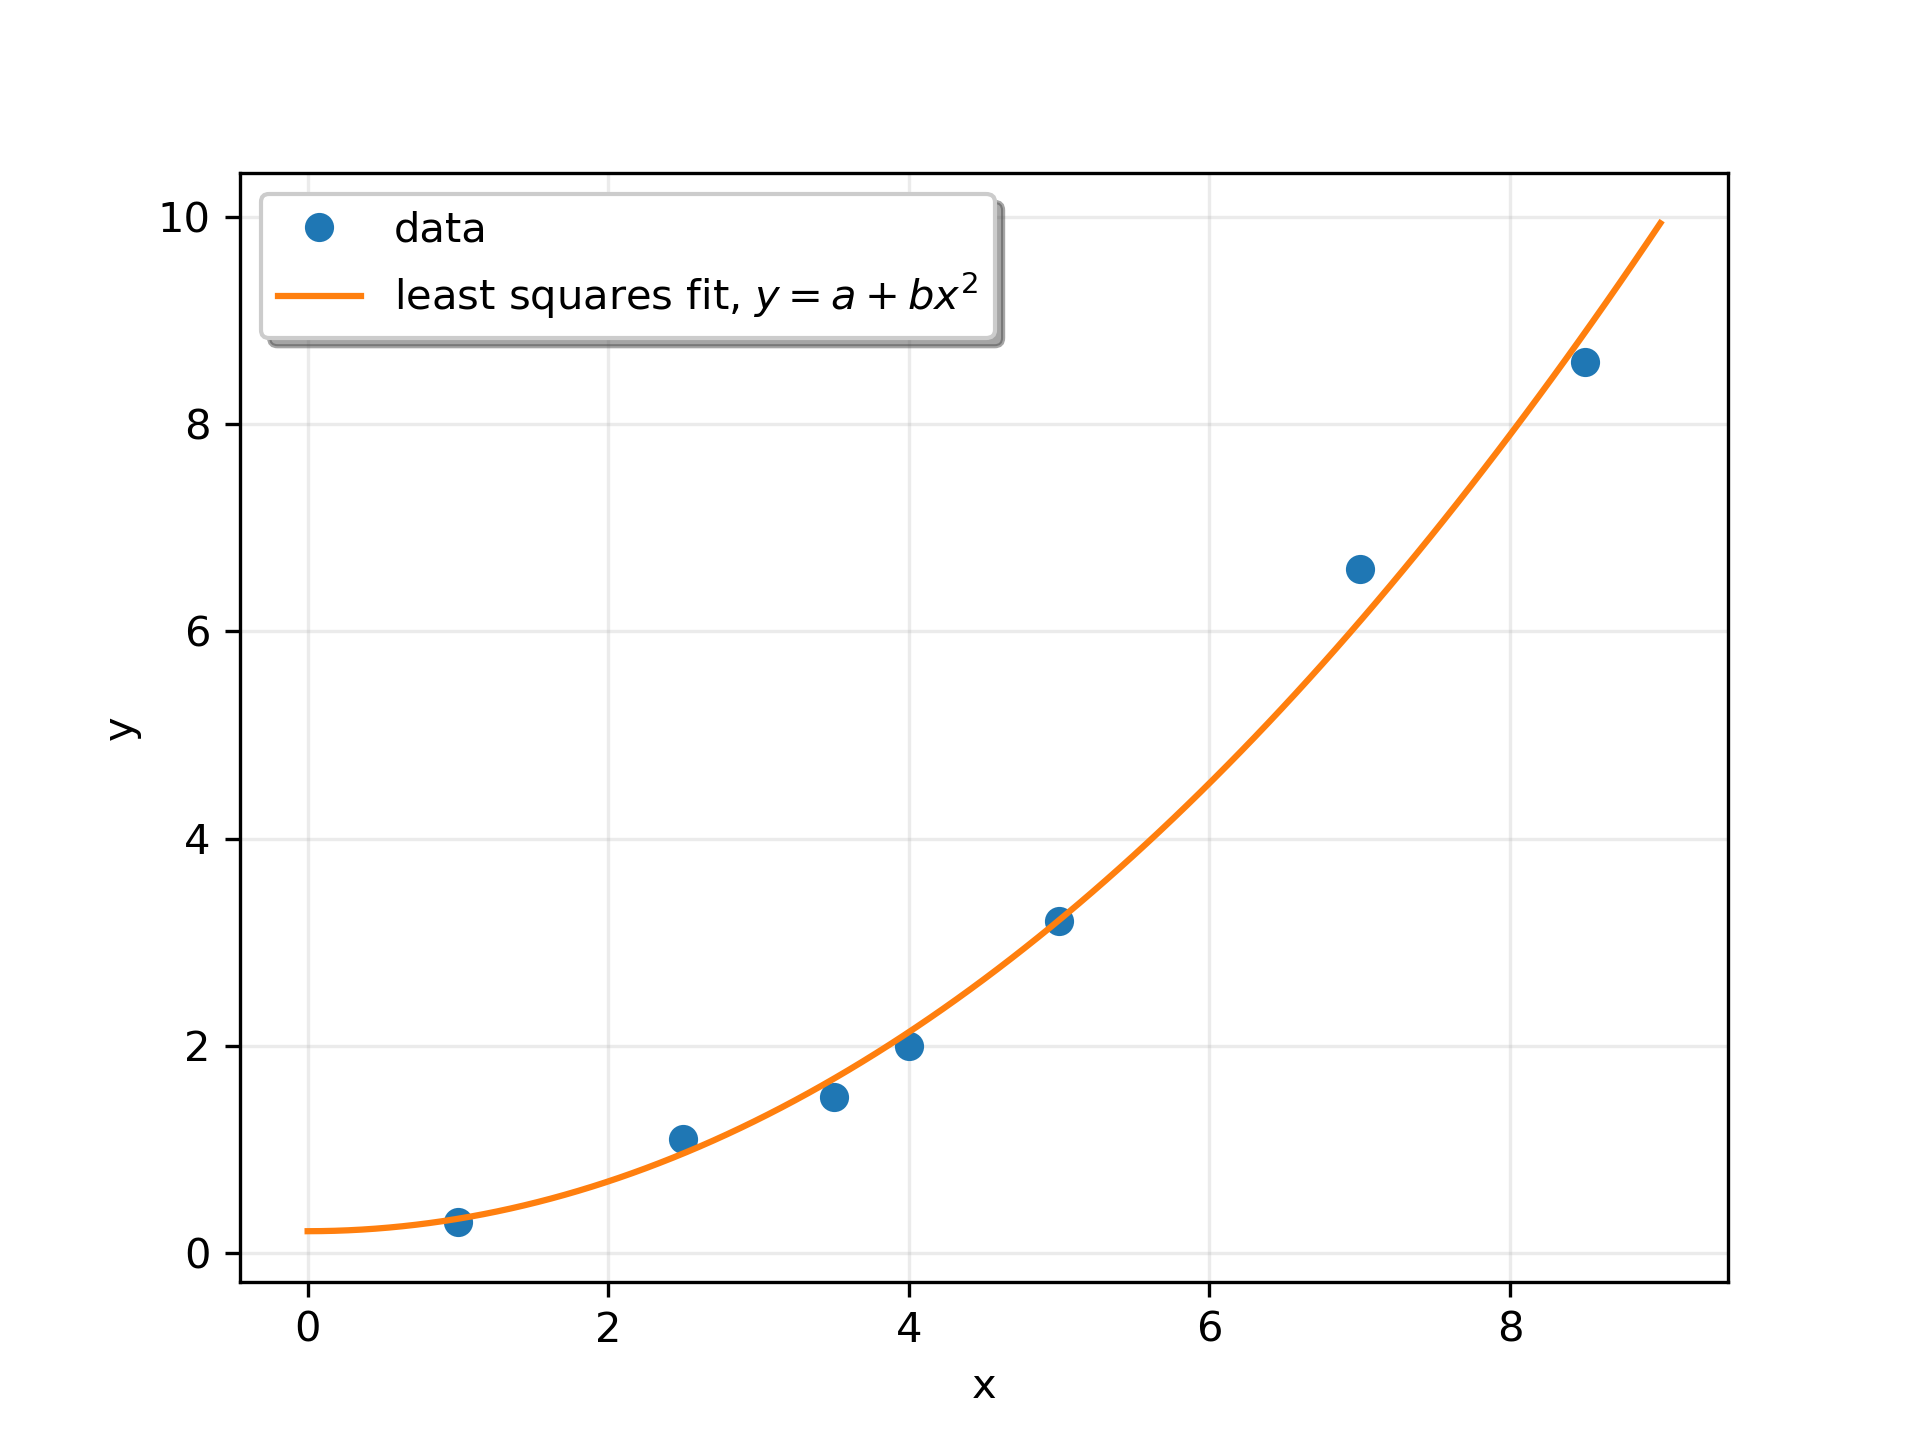
Suppose we have the following data:
>>> x = np.array([1, 2.5, 3.5, 4, 5, 7, 8.5])
... y = np.array([0.3, 1.1, 1.5, 2.0, 3.2, 6.6, 8.6])
We want to fit a quadratic polynomial of the form y = a + b*x**2
to this data. We first form the "design matrix" M, with a constant column of 1s and a column containing x**2
:
>>> M = x[:, np.newaxis]**[0, 2]
... M
array([[  1.  ,   1.  ],
       [  1.  ,   6.25],
       [  1.  ,  12.25],
       [  1.  ,  16.  ],
       [  1.  ,  25.  ],
       [  1.  ,  49.  ],
       [  1.  ,  72.25]])
We want to find the least-squares solution to M.dot(p) = y
, where p
is a vector with length 2 that holds the parameters a
and b
.
>>> p, res, rnk, s = lstsq(M, y)
... p
array([ 0.20925829,  0.12013861])
Plot the data and the fitted curve.
>>> plt.plot(x, y, 'o', label='data')
... xx = np.linspace(0, 9, 101)
... yy = p[0] + p[1]*xx**2
... plt.plot(xx, yy, label='least squares fit, $y = a + bx^2$')
... plt.xlabel('x')
... plt.ylabel('y')
... plt.legend(framealpha=1, shadow=True)
... plt.grid(alpha=0.25)
... plt.show()
The following pages refer to to this document either explicitly or contain code examples using this.
scipy.linalg._basic.solve_circulant
scipy.linalg._basic.lstsq
Hover to see nodes names; edges to Self not shown, Caped at 50 nodes.
Using a canvas is more power efficient and can get hundred of nodes ; but does not allow hyperlinks; , arrows or text (beyond on hover)
SVG is more flexible but power hungry; and does not scale well to 50 + nodes.
All aboves nodes referred to, (or are referred from) current nodes; Edges from Self to other have been omitted (or all nodes would be connected to the central node "self" which is not useful). Nodes are colored by the library they belong to, and scaled with the number of references pointing them