>>> """
===========
Zoom Window
===========
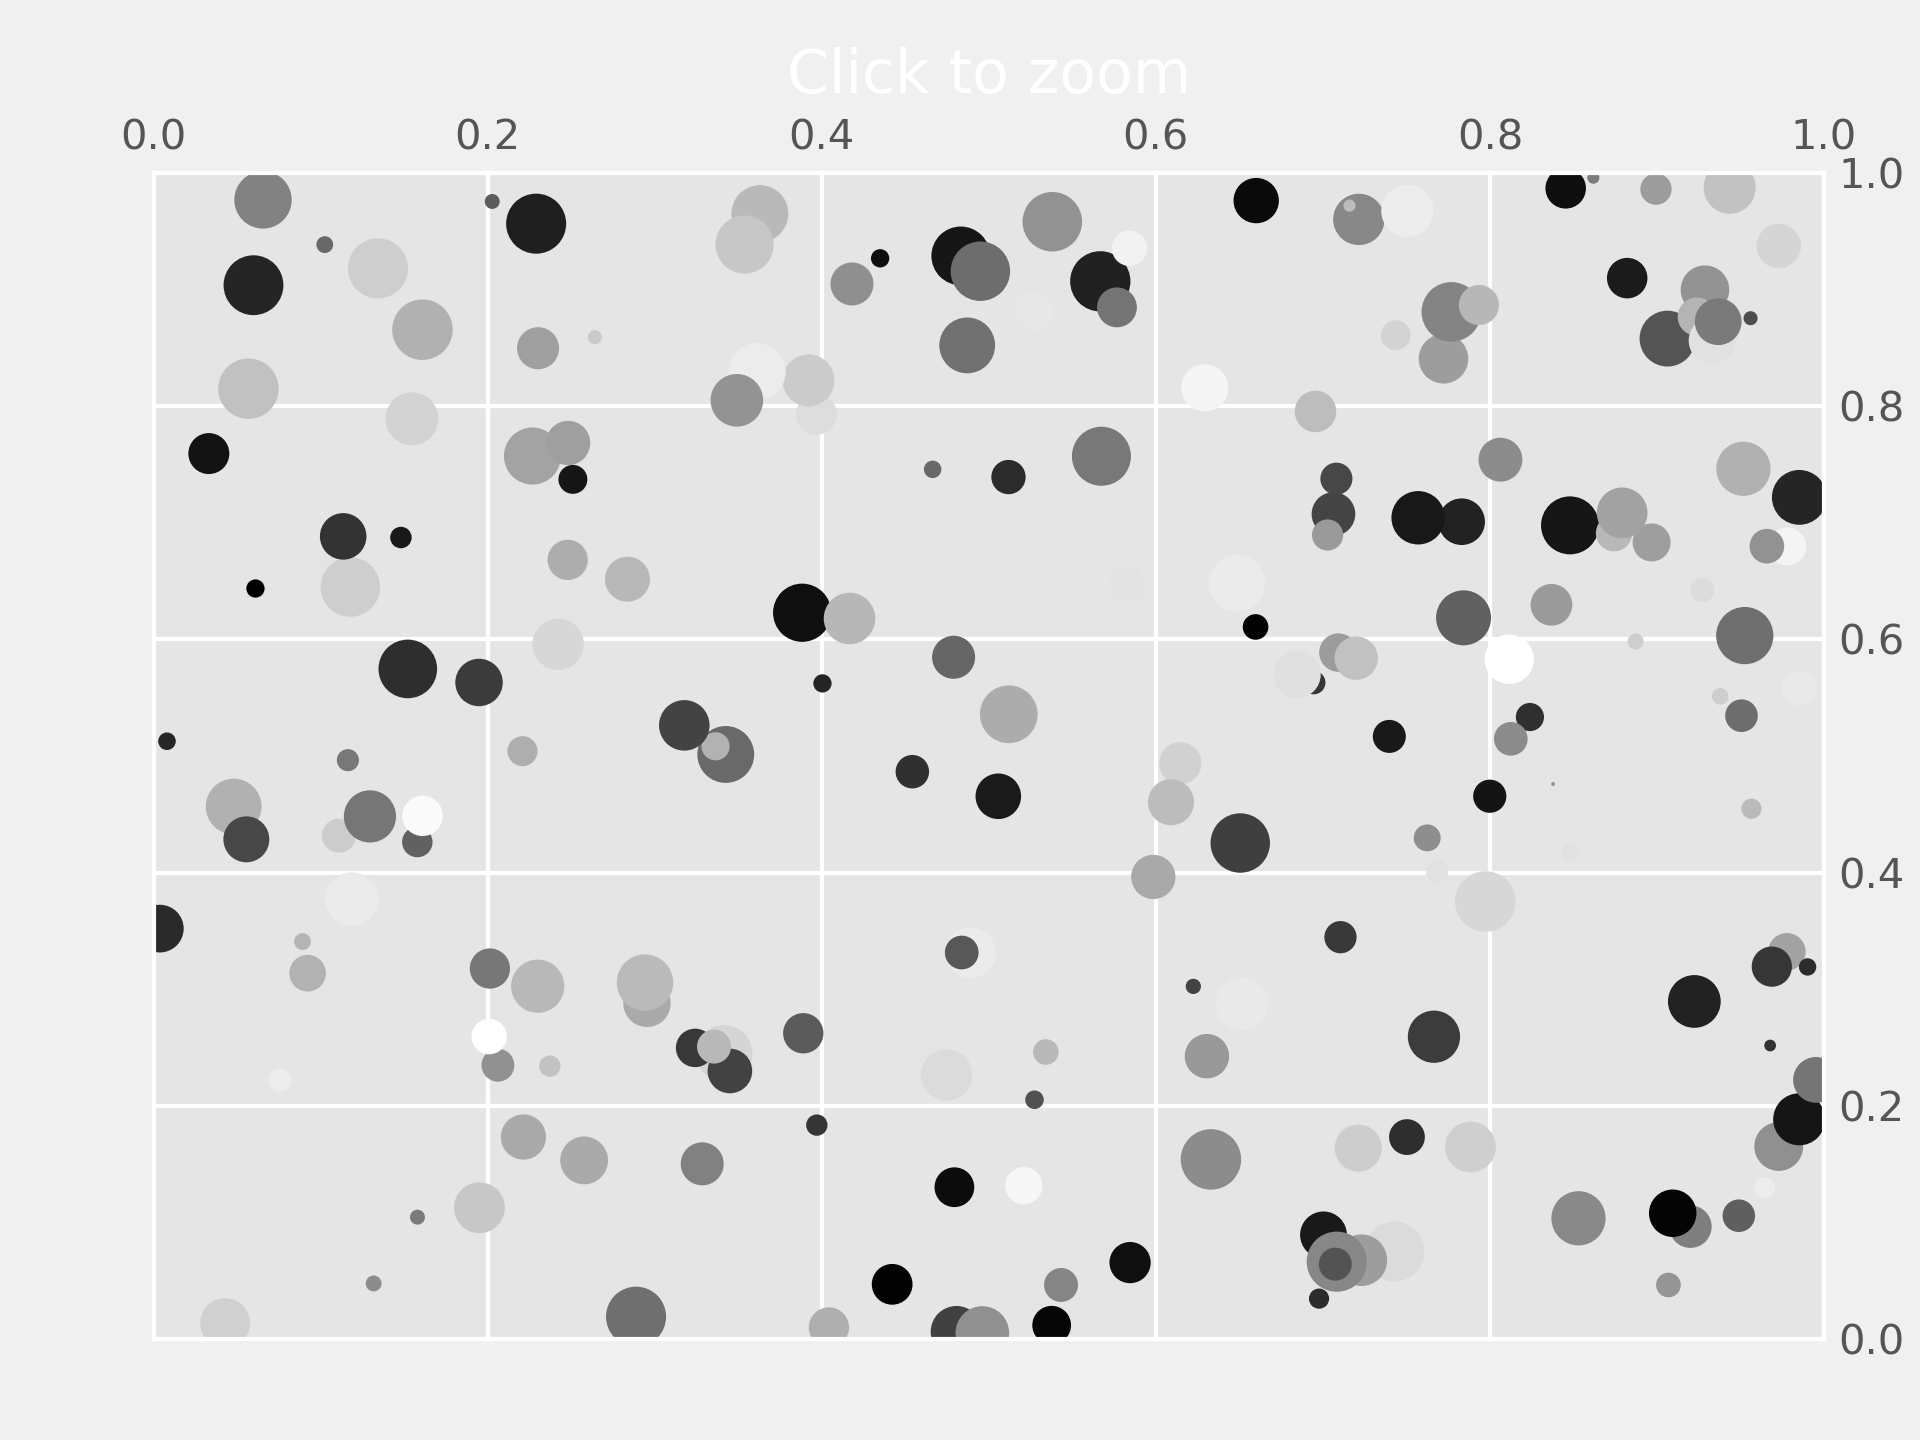
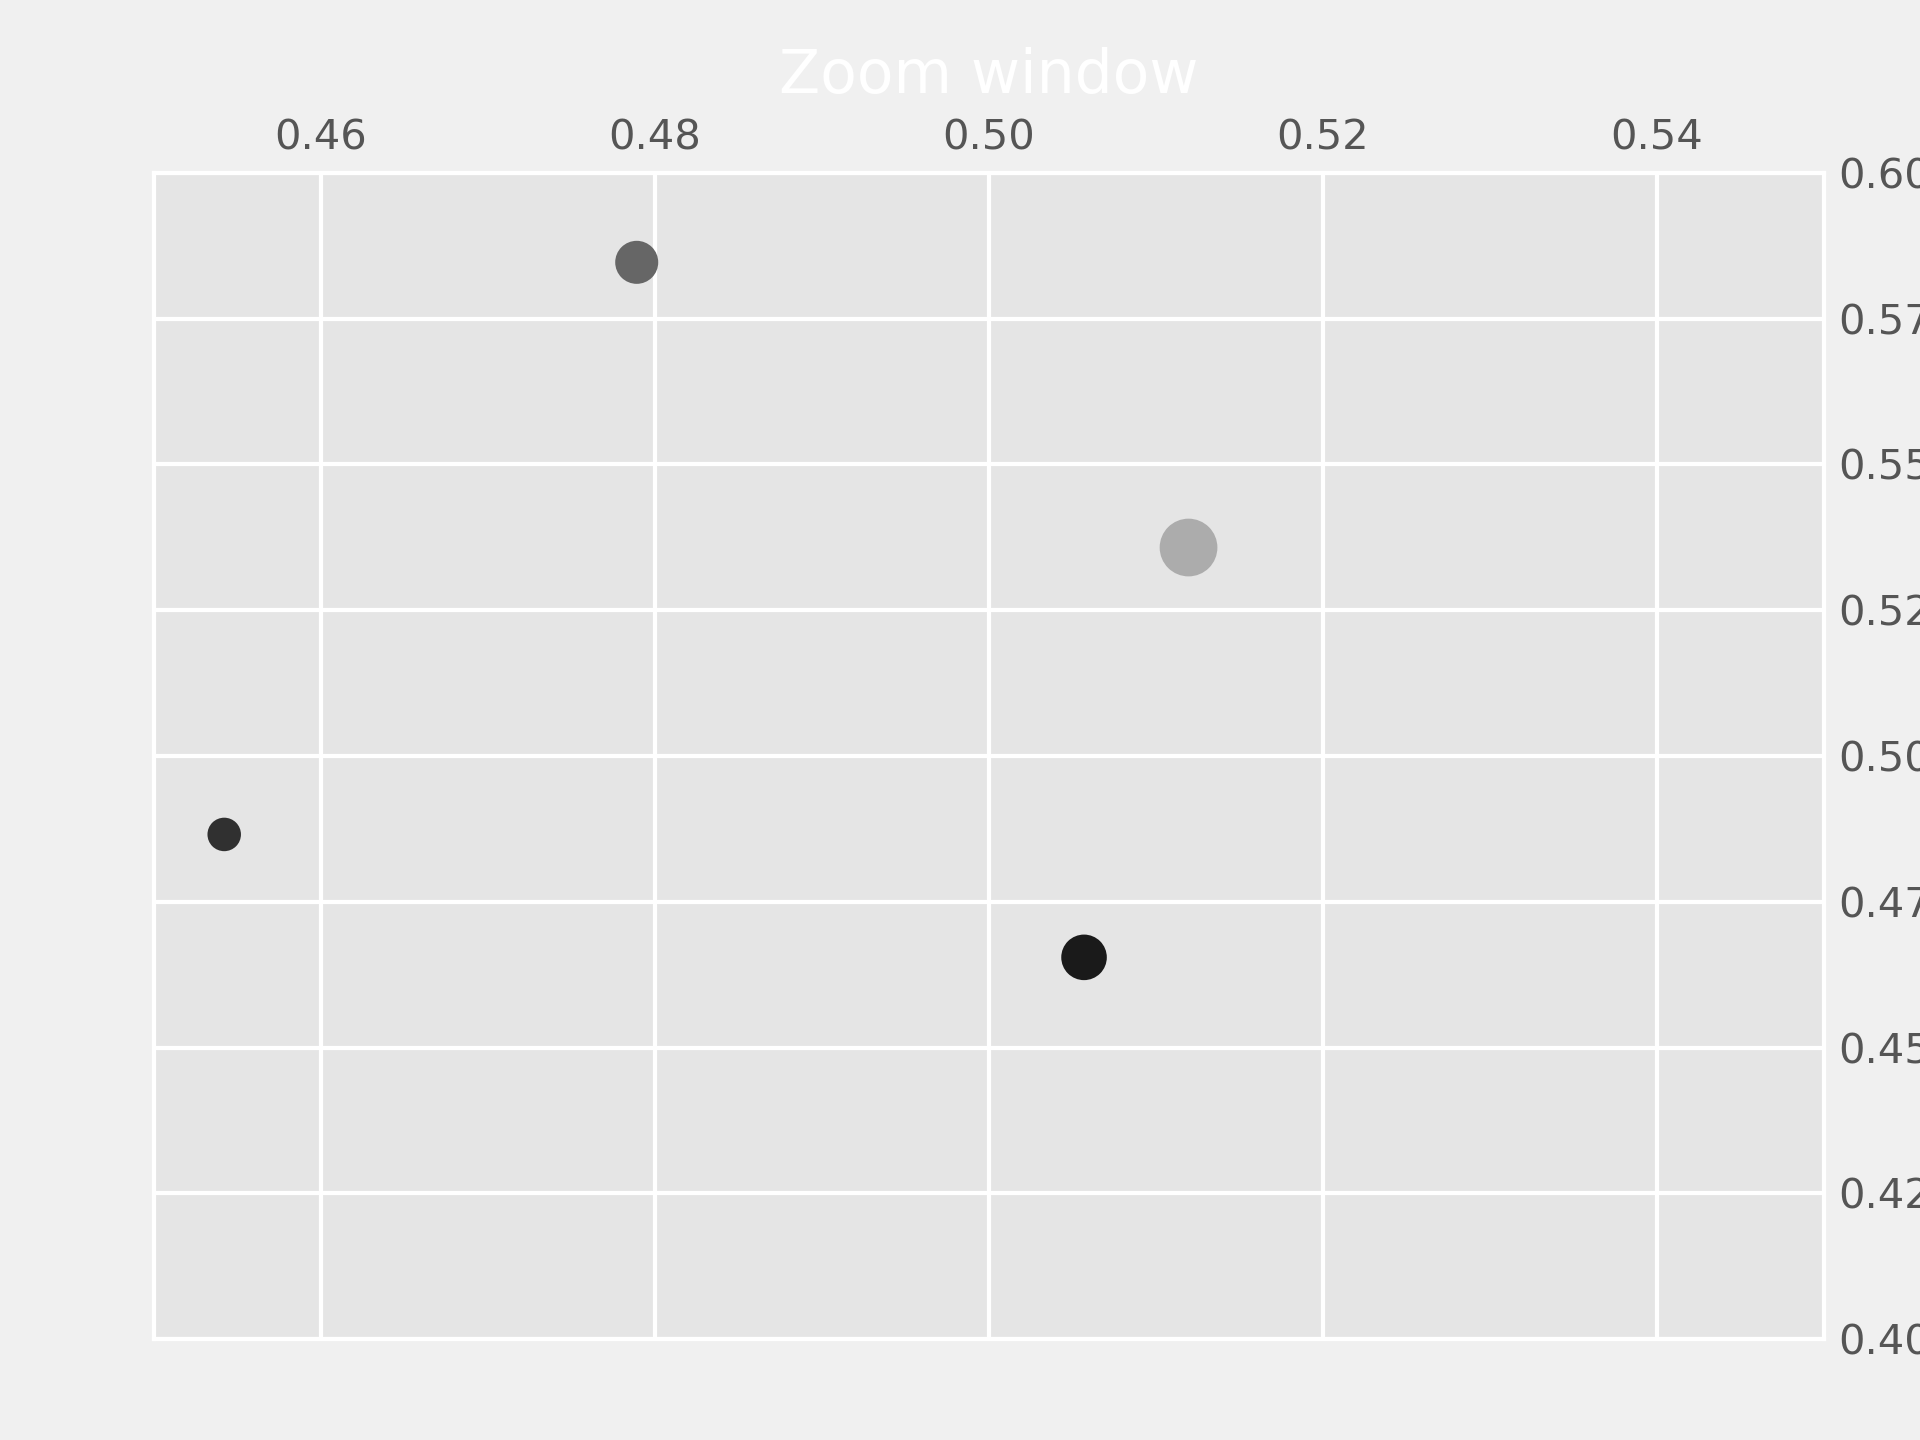
This example shows how to connect events in one window, for example, a mouse
press, to another figure window.
If you click on a point in the first window, the z and y limits of the second
will be adjusted so that the center of the zoom in the second window will be
the (x, y) coordinates of the clicked point.
Note the diameter of the circles in the scatter are defined in points**2, so
their size is independent of the zoom.
"""
...
... import matplotlib.pyplot as plt
... import numpy as np
...
...
... # Fixing random state for reproducibility
... np.random.seed(19680801)
...
... figsrc, axsrc = plt.subplots()
... figzoom, axzoom = plt.subplots()
... axsrc.set(xlim=(0, 1), ylim=(0, 1), autoscale_on=False,
... title='Click to zoom')
... axzoom.set(xlim=(0.45, 0.55), ylim=(0.4, 0.6), autoscale_on=False,
... title='Zoom window')
...
... x, y, s, c = np.random.rand(4, 200)
... s *= 200
...
... axsrc.scatter(x, y, s, c)
... axzoom.scatter(x, y, s, c)
...
...
... def on_press(event):
... if event.button != 1:
... return
... x, y = event.xdata, event.ydata
... axzoom.set_xlim(x - 0.1, x + 0.1)
... axzoom.set_ylim(y - 0.1, y + 0.1)
... figzoom.canvas.draw()
...
... figsrc.canvas.mpl_connect('button_press_event', on_press)
... plt.show()
...