>>> """
===============================
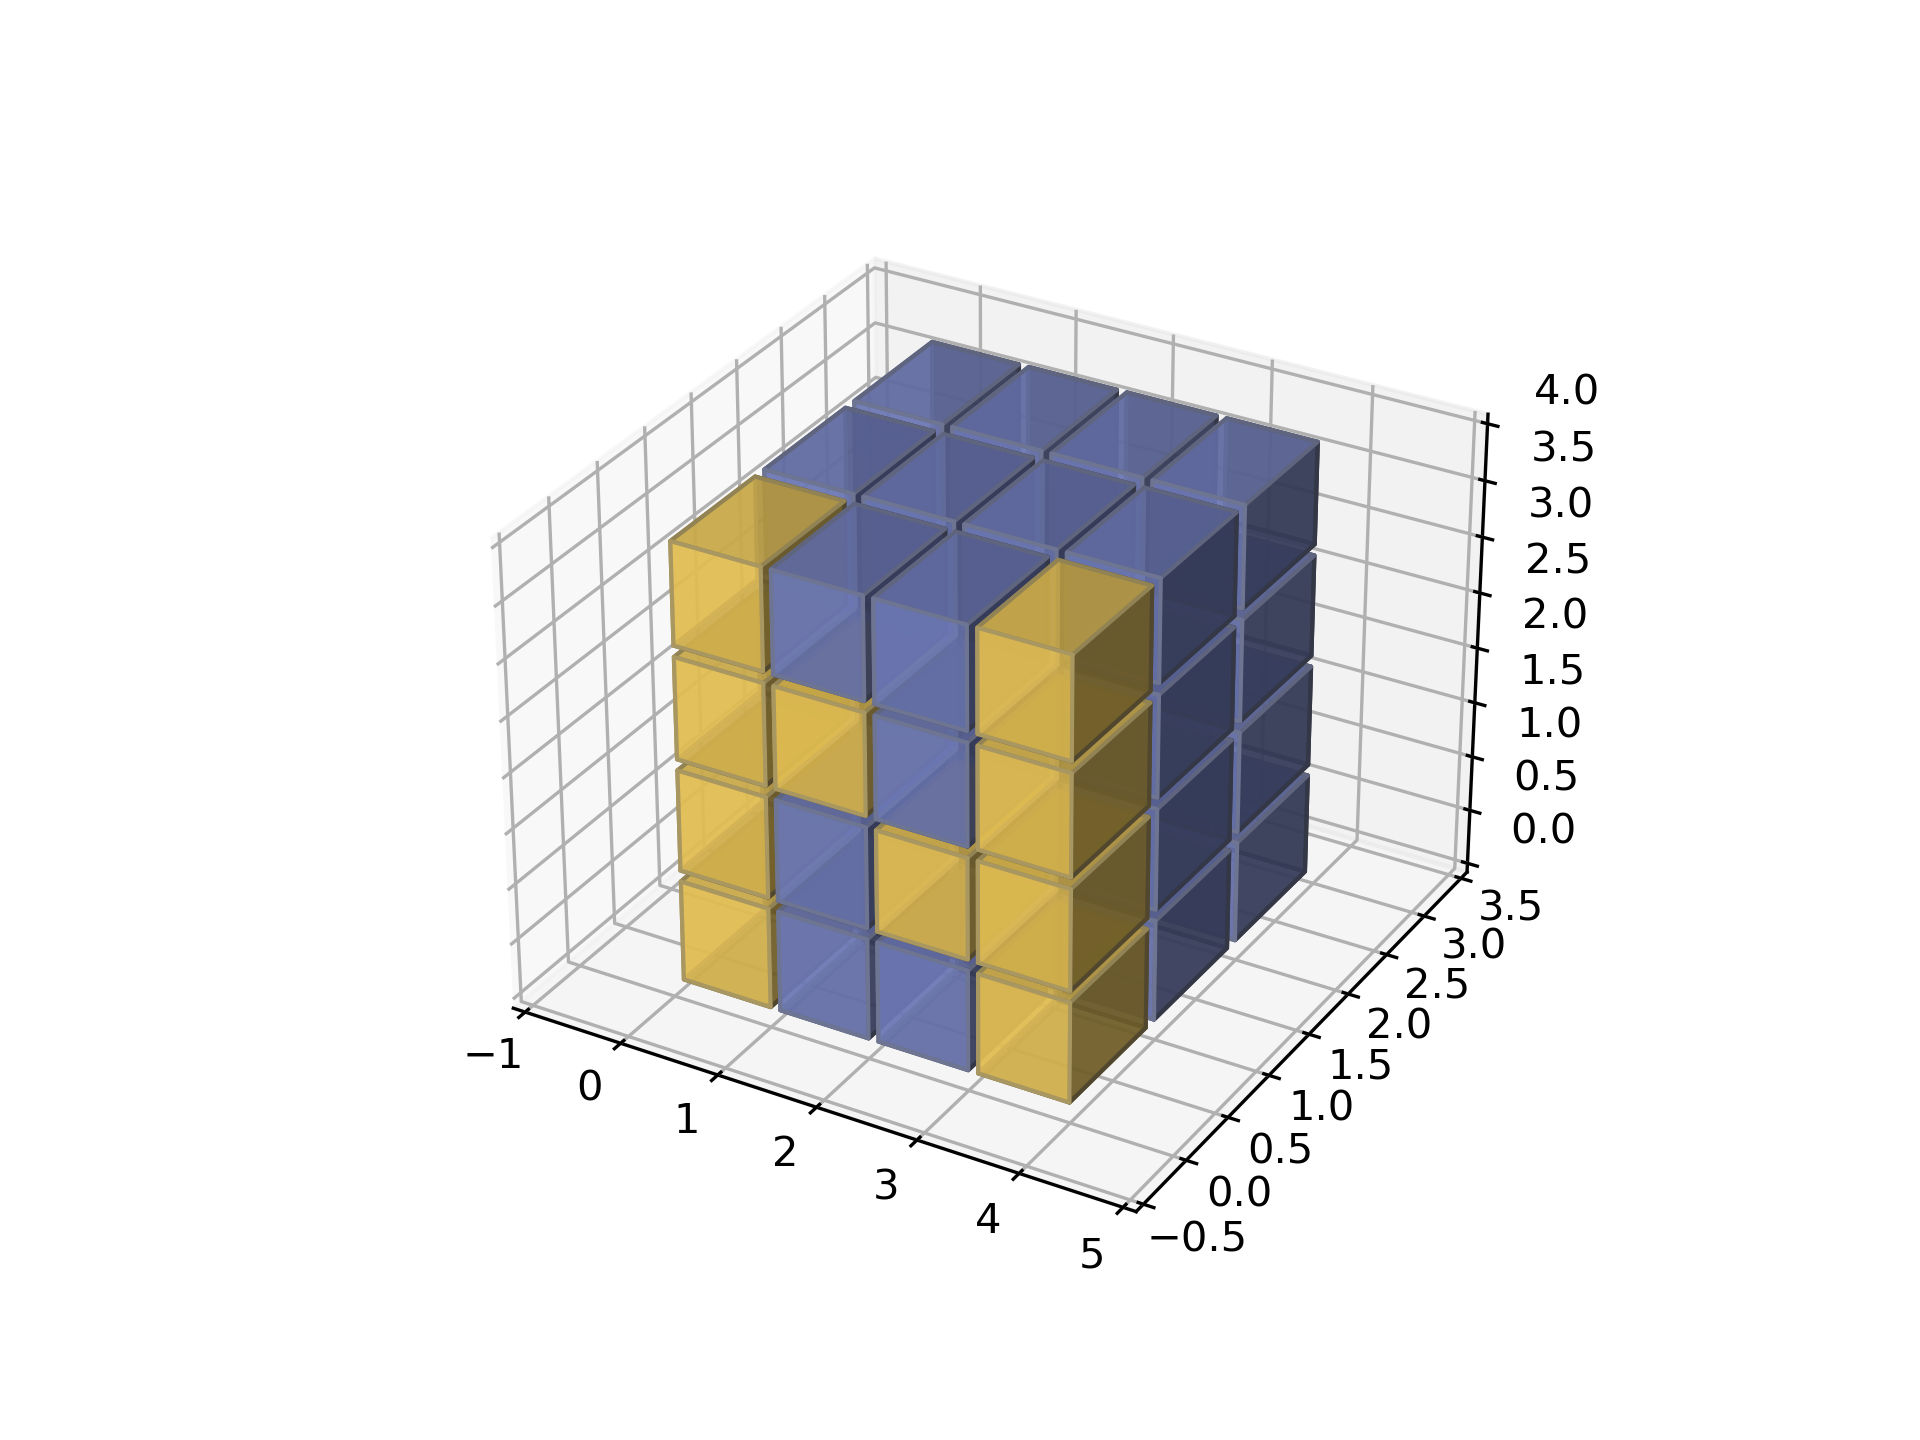
3D voxel plot of the numpy logo
===============================
Demonstrates using `.Axes3D.voxels` with uneven coordinates.
"""
...
... import matplotlib.pyplot as plt
... import numpy as np
...
...
... def explode(data):
... size = np.array(data.shape)*2
... data_e = np.zeros(size - 1, dtype=data.dtype)
... data_e[::2, ::2, ::2] = data
... return data_e
...
... # build up the numpy logo
... n_voxels = np.zeros((4, 3, 4), dtype=bool)
... n_voxels[0, 0, :] = True
... n_voxels[-1, 0, :] = True
... n_voxels[1, 0, 2] = True
... n_voxels[2, 0, 1] = True
... facecolors = np.where(n_voxels, '#FFD65DC0', '#7A88CCC0')
... edgecolors = np.where(n_voxels, '#BFAB6E', '#7D84A6')
... filled = np.ones(n_voxels.shape)
...
... # upscale the above voxel image, leaving gaps
... filled_2 = explode(filled)
... fcolors_2 = explode(facecolors)
... ecolors_2 = explode(edgecolors)
...
... # Shrink the gaps
... x, y, z = np.indices(np.array(filled_2.shape) + 1).astype(float) // 2
... x[0::2, :, :] += 0.05
... y[:, 0::2, :] += 0.05
... z[:, :, 0::2] += 0.05
... x[1::2, :, :] += 0.95
... y[:, 1::2, :] += 0.95
... z[:, :, 1::2] += 0.95
...
... ax = plt.figure().add_subplot(projection='3d')
... ax.voxels(x, y, z, filled_2, facecolors=fcolors_2, edgecolors=ecolors_2)
...
... plt.show()
...