>>> """
=============
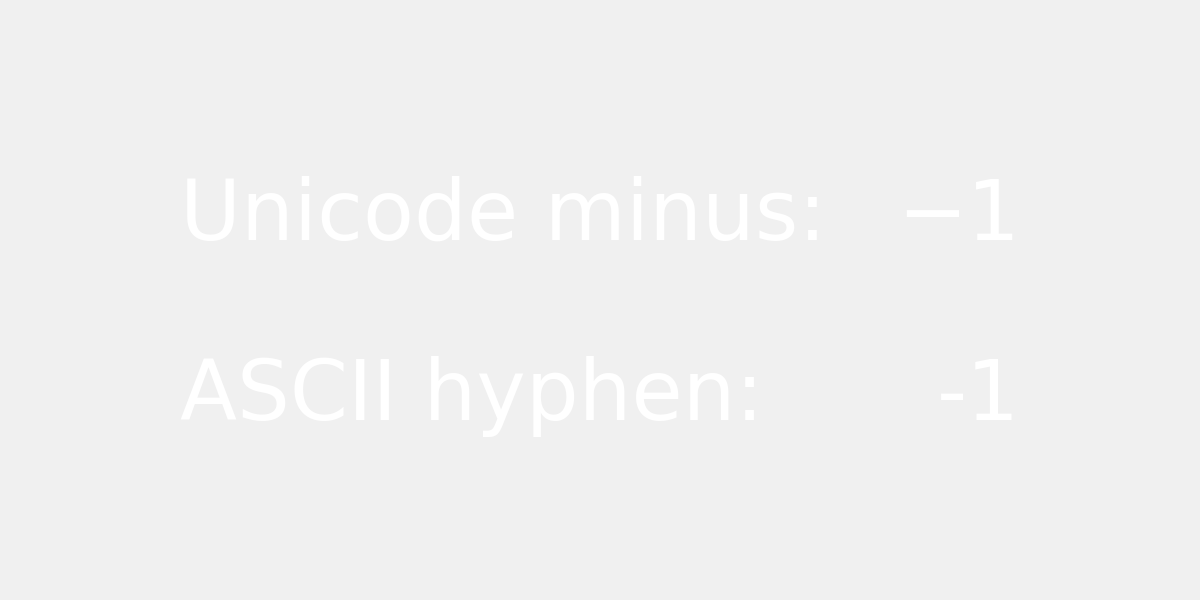
Unicode minus
=============
By default, tick labels at negative values are rendered using a `Unicode
minus`__ (U+2212) rather than an ASCII hyphen (U+002D). This can be controlled
by setting :rc:`axes.unicode_minus`.
__ https://en.wikipedia.org/wiki/Plus_and_minus_signs#Character_codes
The replacement is performed at draw time of the tick labels (usually during a
`.pyplot.show()` or `.pyplot.savefig()` call). Therefore, all tick labels of
the figure follow the same setting and we cannot demonstrate both glyphs on
real tick labels of the same figure simultaneously.
Instead, this example simply showcases the difference between the two glyphs
in a magnified font.
"""
...
... import matplotlib.pyplot as plt
...
... fig = plt.figure(figsize=(4, 2))
... fig.text(.15, .6, "Unicode minus:", fontsize=20)
... fig.text(.85, .6, "\N{MINUS SIGN}1", ha='right', fontsize=20)
... fig.text(.15, .3, "ASCII hyphen:", fontsize=20)
... fig.text(.85, .3, "-1", ha='right', fontsize=20)
... plt.show()
...