>>> """
===========================
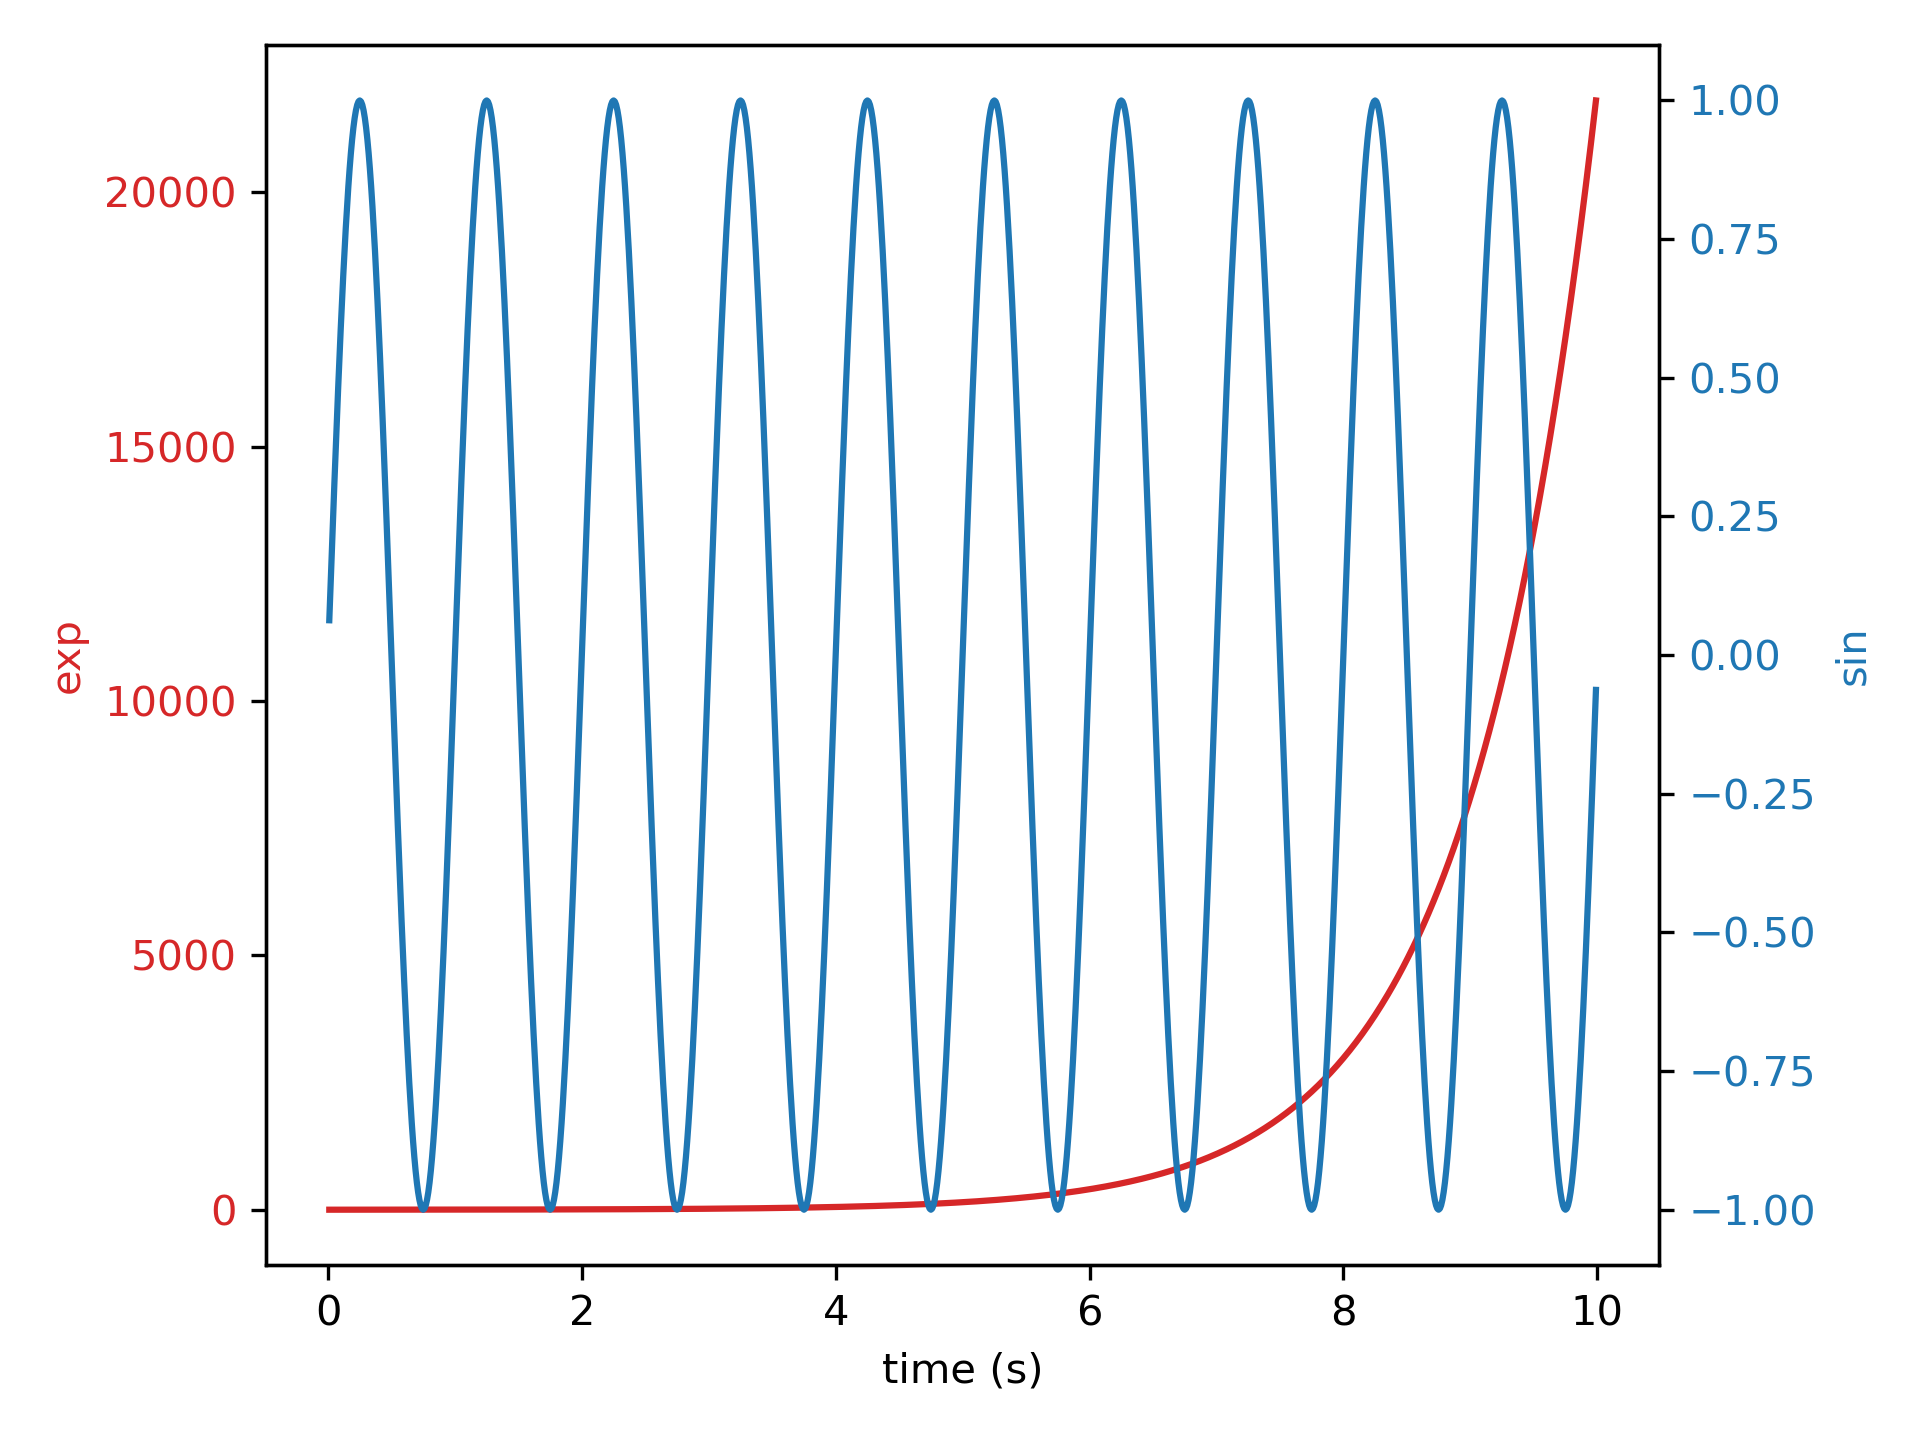
Plots with different scales
===========================
Two plots on the same axes with different left and right scales.
The trick is to use *two different axes* that share the same *x* axis.
You can use separate `matplotlib.ticker` formatters and locators as
desired since the two axes are independent.
Such axes are generated by calling the `.Axes.twinx` method. Likewise,
`.Axes.twiny` is available to generate axes that share a *y* axis but
have different top and bottom scales.
"""
... import numpy as np
... import matplotlib.pyplot as plt
...
... # Create some mock data
... t = np.arange(0.01, 10.0, 0.01)
... data1 = np.exp(t)
... data2 = np.sin(2 * np.pi * t)
...
... fig, ax1 = plt.subplots()
...
... color = 'tab:red'
... ax1.set_xlabel('time (s)')
... ax1.set_ylabel('exp', color=color)
... ax1.plot(t, data1, color=color)
... ax1.tick_params(axis='y', labelcolor=color)
...
... ax2 = ax1.twinx() # instantiate a second axes that shares the same x-axis
...
... color = 'tab:blue'
... ax2.set_ylabel('sin', color=color) # we already handled the x-label with ax1
... ax2.plot(t, data2, color=color)
... ax2.tick_params(axis='y', labelcolor=color)
...
... fig.tight_layout() # otherwise the right y-label is slightly clipped
... plt.show()
...
... #############################################################################
... #
... # .. admonition:: References
... #
... # The use of the following functions, methods, classes and modules is shown
... # in this example:
... #
... # - `matplotlib.axes.Axes.twinx` / `matplotlib.pyplot.twinx`
... # - `matplotlib.axes.Axes.twiny` / `matplotlib.pyplot.twiny`
... # - `matplotlib.axes.Axes.tick_params` / `matplotlib.pyplot.tick_params`
...