>>> """
==========================================
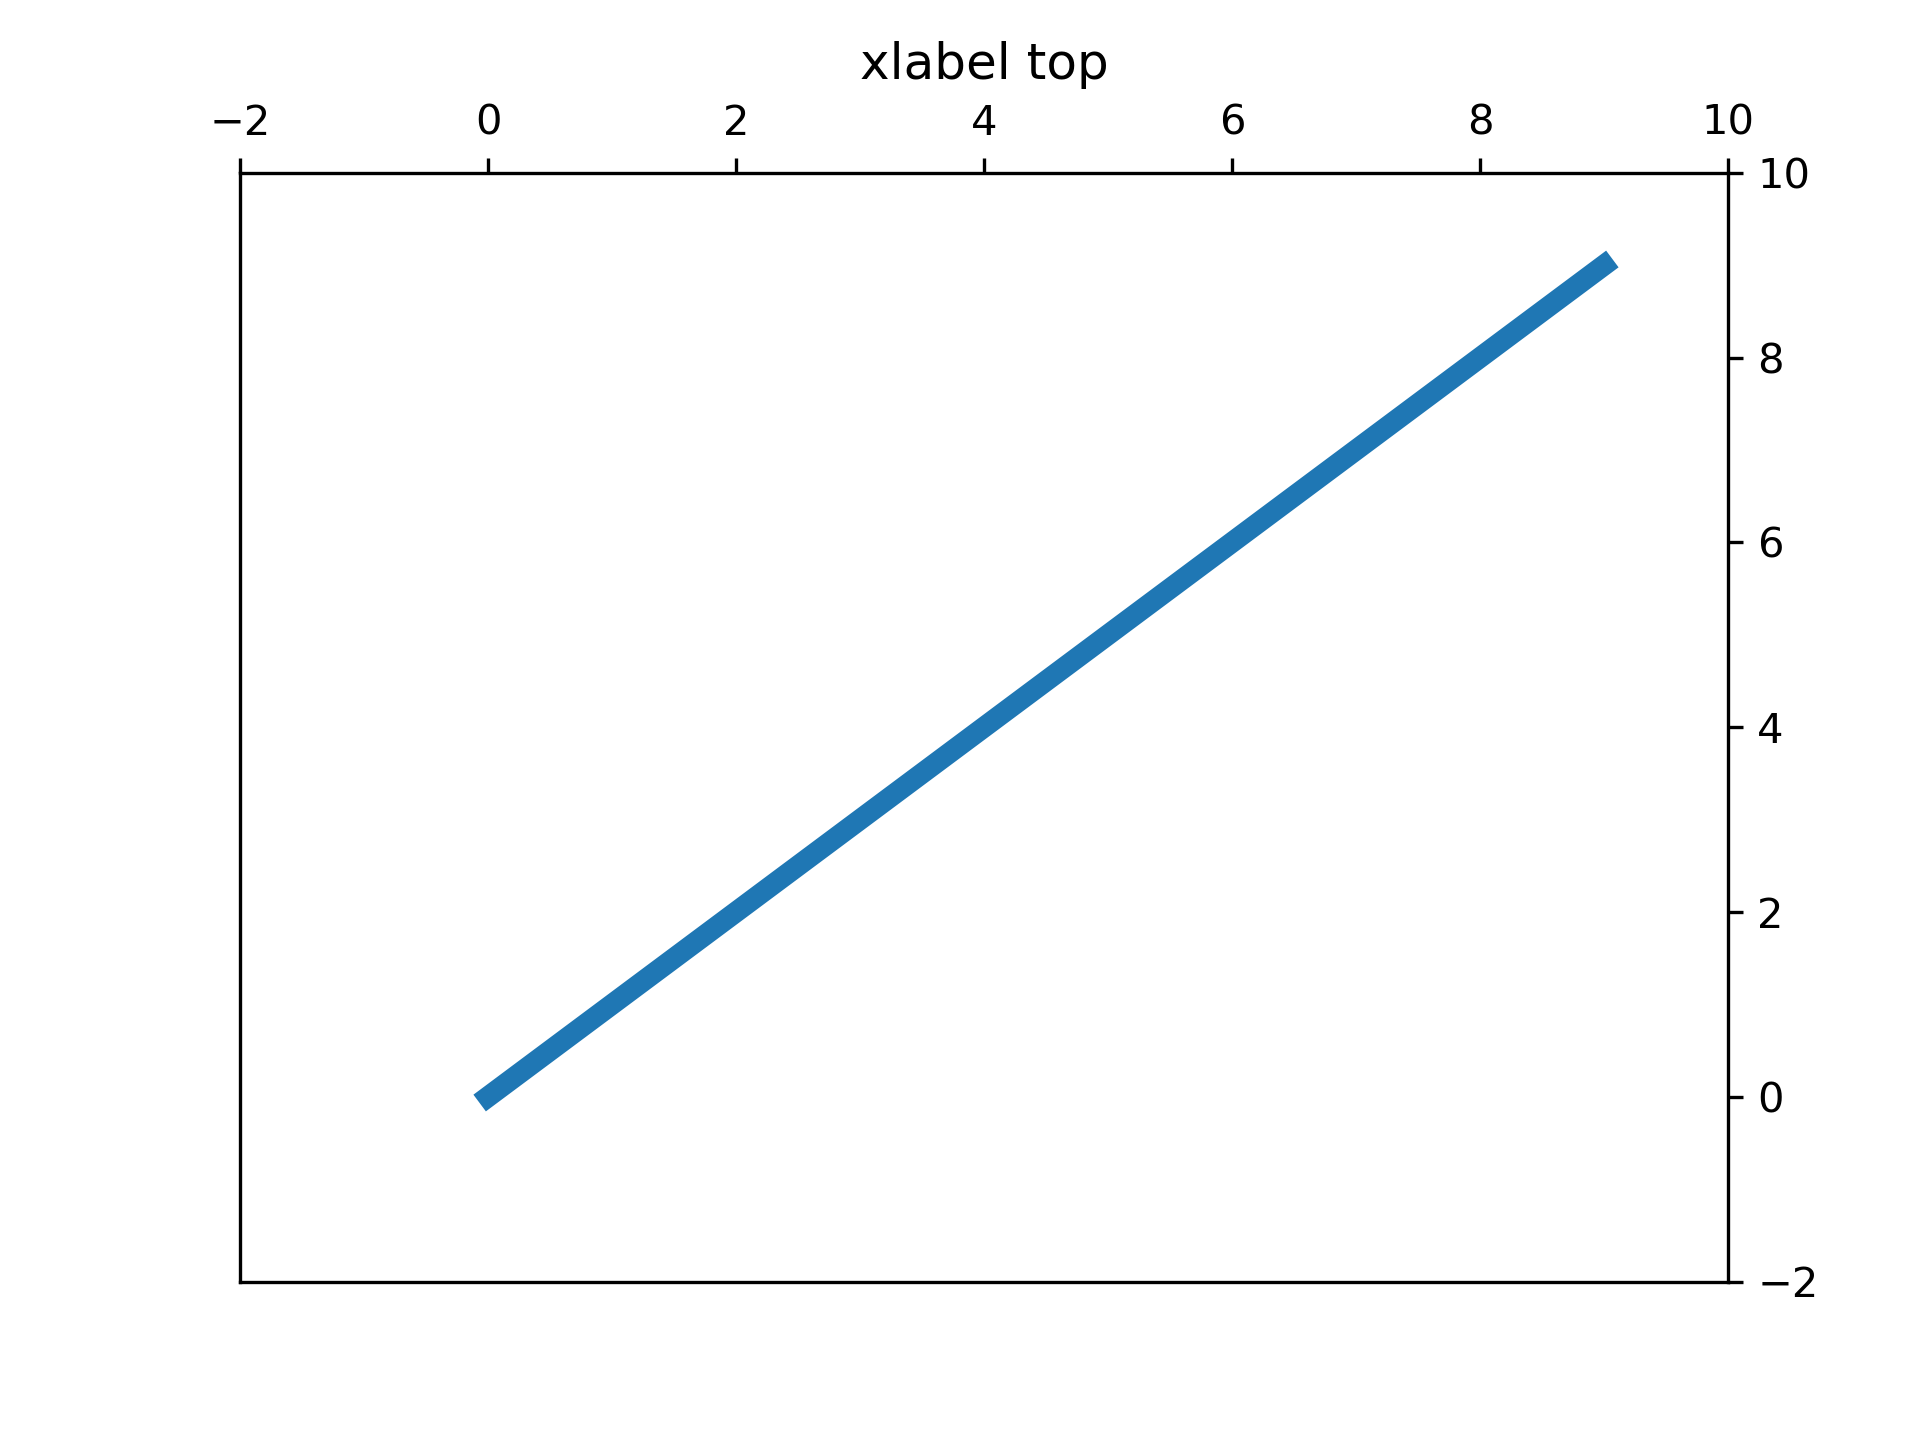
Set default x-axis tick labels on the top
==========================================
We can use :rc:`xtick.labeltop` and :rc:`xtick.top` and :rc:`xtick.labelbottom`
and :rc:`xtick.bottom` to control where on the axes ticks and their labels
appear.
These properties can also be set in ``.matplotlib/matplotlibrc``.
"""
...
... import matplotlib.pyplot as plt
... import numpy as np
...
...
... plt.rcParams['xtick.bottom'] = plt.rcParams['xtick.labelbottom'] = False
... plt.rcParams['xtick.top'] = plt.rcParams['xtick.labeltop'] = True
...
... x = np.arange(10)
...
... fig, ax = plt.subplots()
...
... ax.plot(x)
... ax.set_title('xlabel top') # Note title moves to make room for ticks
...
... plt.show()
...