>>> """
============================================
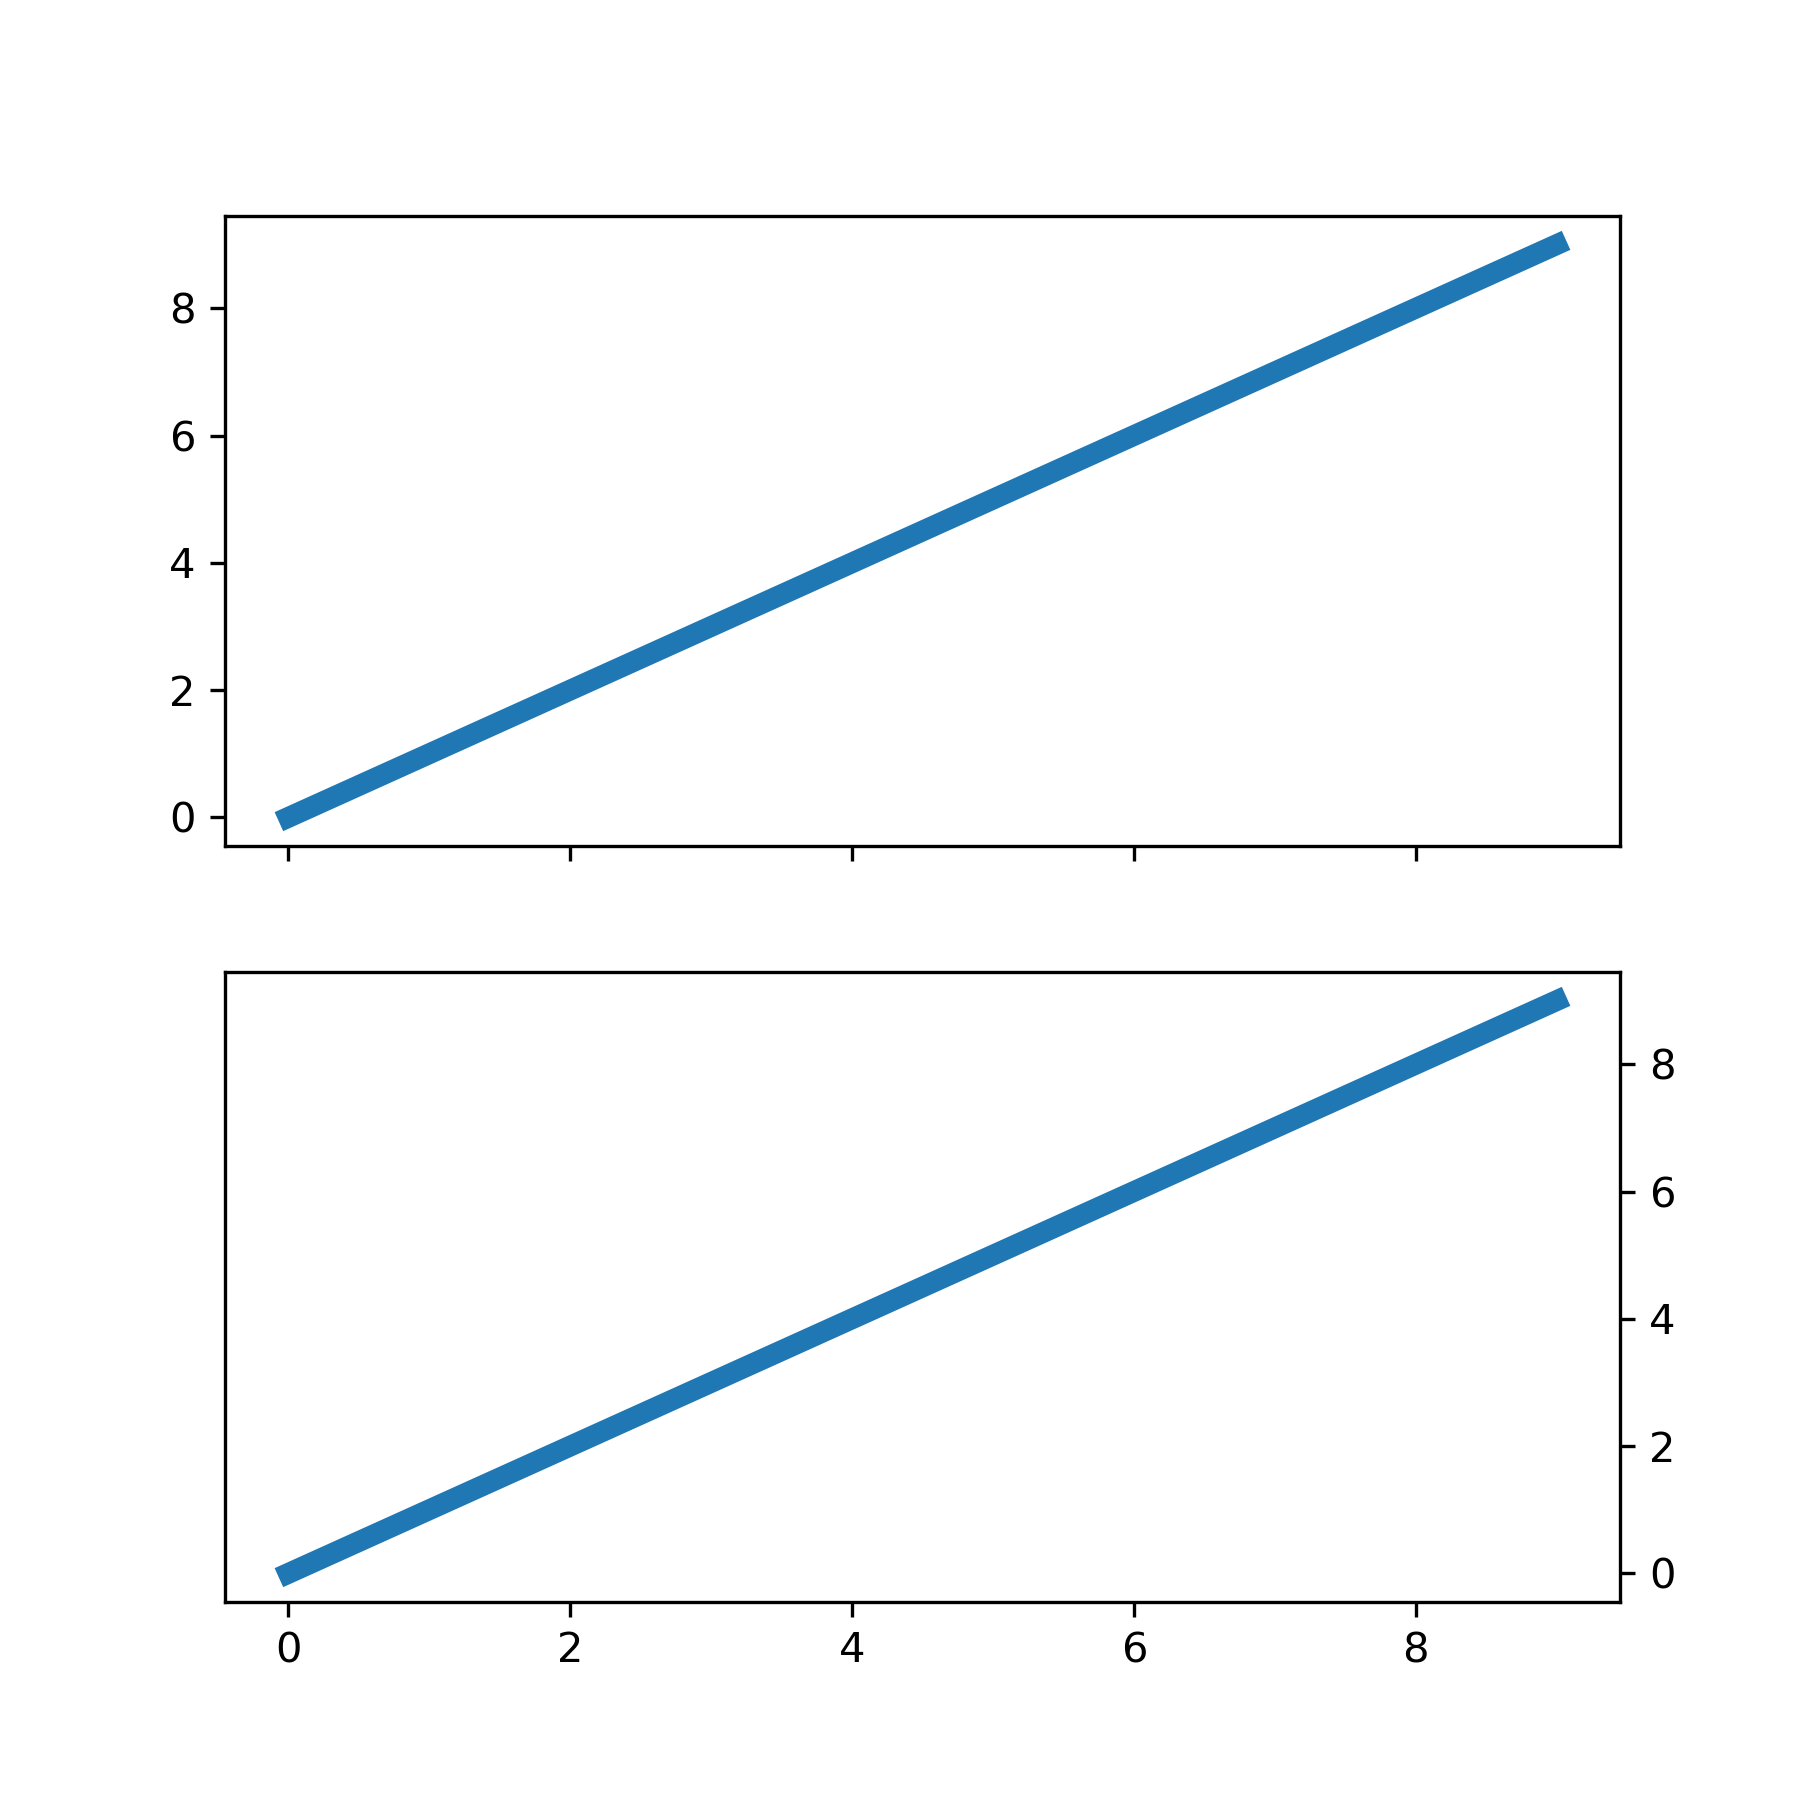
Set default y-axis tick labels on the right
============================================
We can use :rc:`ytick.labelright` (default False) and :rc:`ytick.right`
(default False) and :rc:`ytick.labelleft` (default True) and :rc:`ytick.left`
(default True) to control where on the axes ticks and their labels appear.
These properties can also be set in the ``.matplotlib/matplotlibrc``.
"""
... import matplotlib.pyplot as plt
... import numpy as np
...
... plt.rcParams['ytick.right'] = plt.rcParams['ytick.labelright'] = True
... plt.rcParams['ytick.left'] = plt.rcParams['ytick.labelleft'] = False
...
... x = np.arange(10)
...
... fig, (ax0, ax1) = plt.subplots(2, 1, sharex=True, figsize=(6, 6))
...
... ax0.plot(x)
... ax0.yaxis.tick_left()
...
... # use default parameter in rcParams, not calling tick_right()
... ax1.plot(x)
...
... plt.show()
...