>>> """
===============
Tick formatters
===============
Tick formatters define how the numeric value associated with a tick on an axis
is formatted as a string.
This example illustrates the usage and effect of the most common formatters.
"""
...
... import matplotlib.pyplot as plt
... from matplotlib import ticker
...
...
... def setup(ax, title):
... """Set up common parameters for the Axes in the example."""
... # only show the bottom spine
... ax.yaxis.set_major_locator(ticker.NullLocator())
... ax.spines.right.set_color('none')
... ax.spines.left.set_color('none')
... ax.spines.top.set_color('none')
...
... # define tick positions
... ax.xaxis.set_major_locator(ticker.MultipleLocator(1.00))
... ax.xaxis.set_minor_locator(ticker.MultipleLocator(0.25))
...
... ax.xaxis.set_ticks_position('bottom')
... ax.tick_params(which='major', width=1.00, length=5)
... ax.tick_params(which='minor', width=0.75, length=2.5, labelsize=10)
... ax.set_xlim(0, 5)
... ax.set_ylim(0, 1)
... ax.text(0.0, 0.2, title, transform=ax.transAxes,
... fontsize=14, fontname='Monospace', color='tab:blue')
...
...
... #############################################################################
... # Tick formatters can be set in one of two ways, either by passing a ``str``
... # or function to `~.Axis.set_major_formatter` or `~.Axis.set_minor_formatter`,
... # or by creating an instance of one of the various `~.ticker.Formatter` classes
... # and providing that to `~.Axis.set_major_formatter` or
... # `~.Axis.set_minor_formatter`.
... #
... # The first two examples directly pass a ``str`` or function.
...
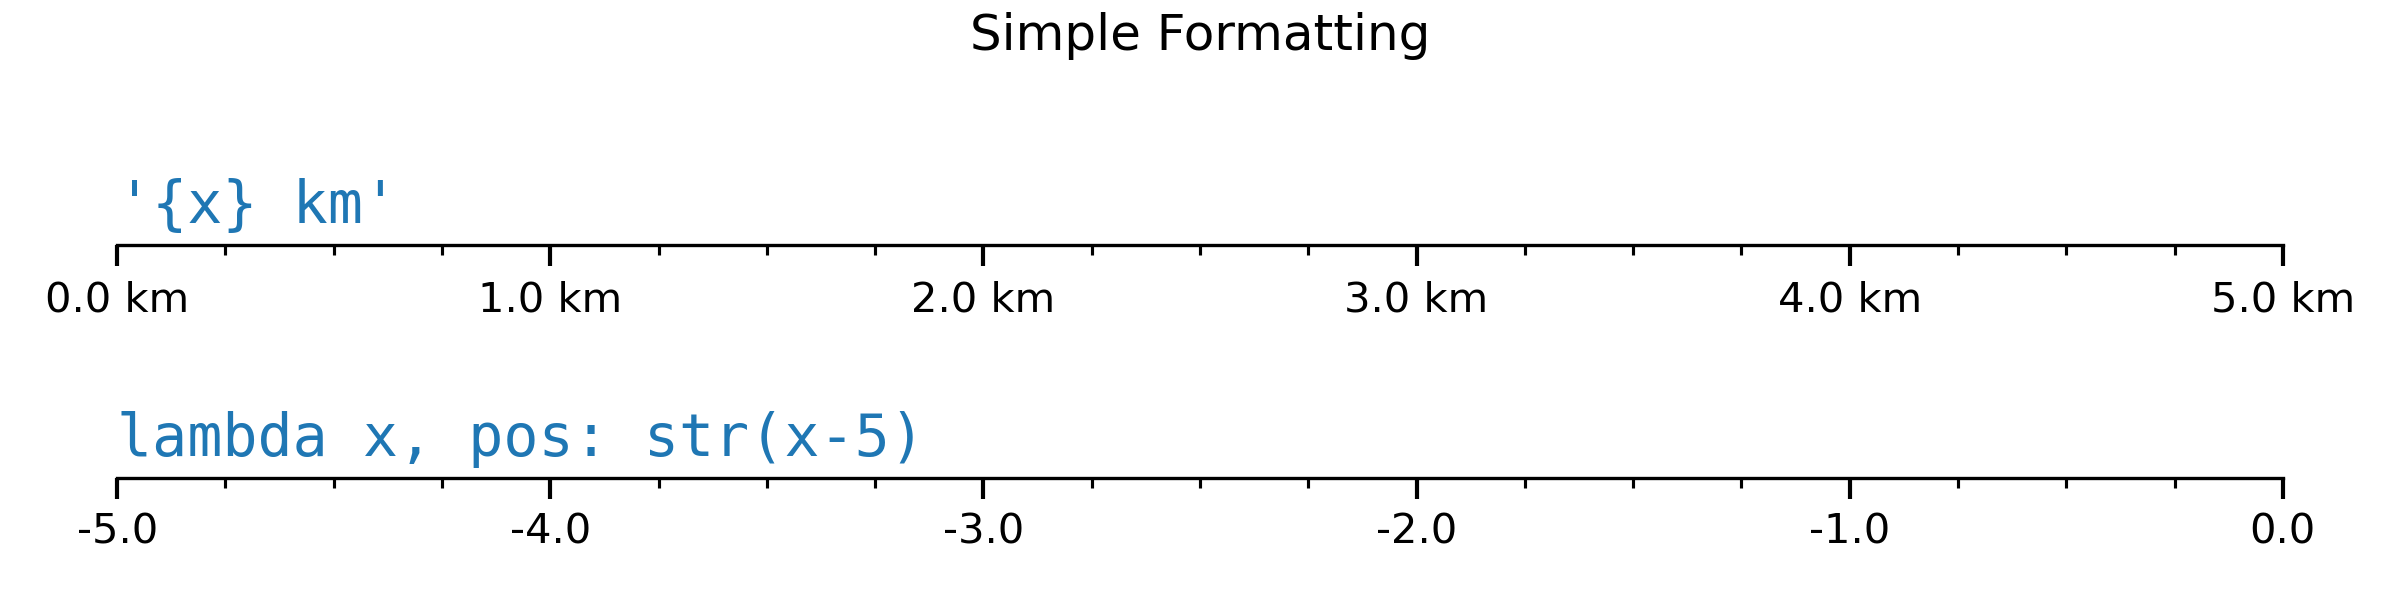
... fig0, axs0 = plt.subplots(2, 1, figsize=(8, 2))
... fig0.suptitle('Simple Formatting')
...
... # A ``str``, using format string function syntax, can be used directly as a
... # formatter. The variable ``x`` is the tick value and the variable ``pos`` is
... # tick position. This creates a StrMethodFormatter automatically.
... setup(axs0[0], title="'{x} km'")
... axs0[0].xaxis.set_major_formatter('{x} km')
...
... # A function can also be used directly as a formatter. The function must take
... # two arguments: ``x`` for the tick value and ``pos`` for the tick position,
... # and must return a ``str``. This creates a FuncFormatter automatically.
... setup(axs0[1], title="lambda x, pos: str(x-5)")
... axs0[1].xaxis.set_major_formatter(lambda x, pos: str(x-5))
...
... fig0.tight_layout()
...
...
... #############################################################################
... # The remaining examples use `.Formatter` objects.
...
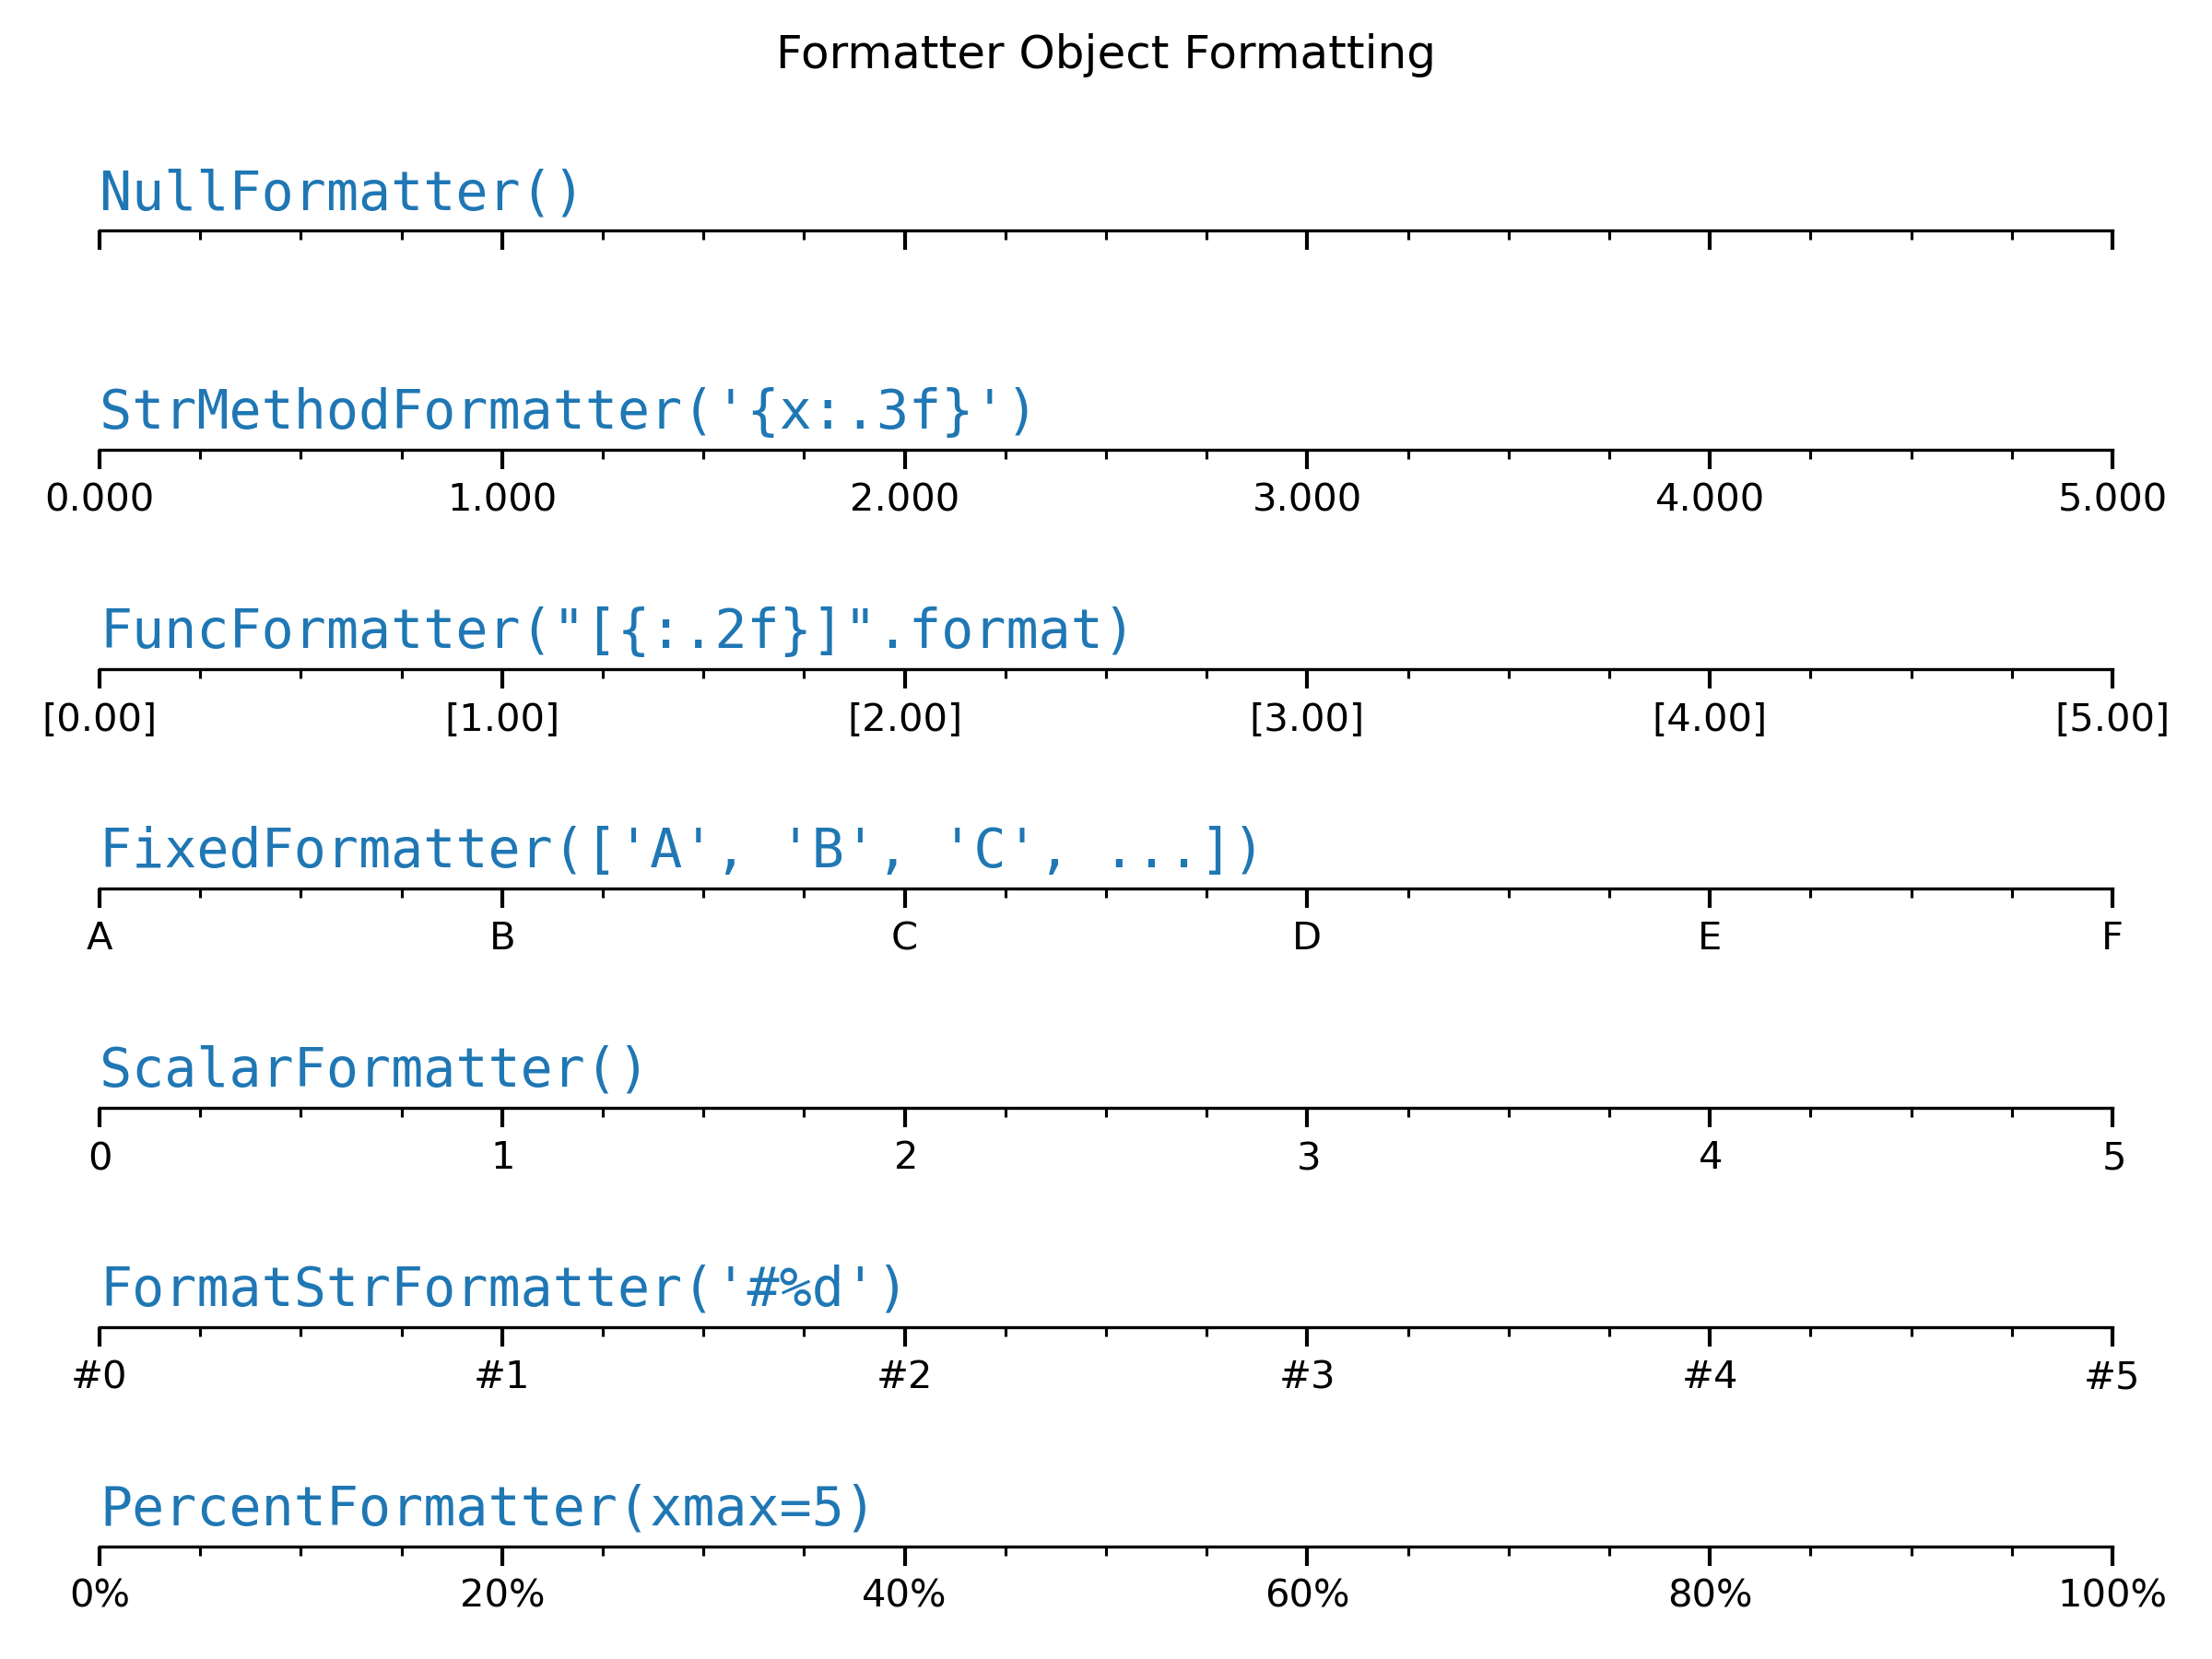
... fig1, axs1 = plt.subplots(7, 1, figsize=(8, 6))
... fig1.suptitle('Formatter Object Formatting')
...
... # Null formatter
... setup(axs1[0], title="NullFormatter()")
... axs1[0].xaxis.set_major_formatter(ticker.NullFormatter())
...
... # StrMethod formatter
... setup(axs1[1], title="StrMethodFormatter('{x:.3f}')")
... axs1[1].xaxis.set_major_formatter(ticker.StrMethodFormatter("{x:.3f}"))
...
...
... # FuncFormatter can be used as a decorator
... @ticker.FuncFormatter
... def major_formatter(x, pos):
... return f'[{x:.2f}]'
...
...
... setup(axs1[2], title='FuncFormatter("[{:.2f}]".format)')
... axs1[2].xaxis.set_major_formatter(major_formatter)
...
... # Fixed formatter
... setup(axs1[3], title="FixedFormatter(['A', 'B', 'C', ...])")
... # FixedFormatter should only be used together with FixedLocator.
... # Otherwise, one cannot be sure where the labels will end up.
... positions = [0, 1, 2, 3, 4, 5]
... labels = ['A', 'B', 'C', 'D', 'E', 'F']
... axs1[3].xaxis.set_major_locator(ticker.FixedLocator(positions))
... axs1[3].xaxis.set_major_formatter(ticker.FixedFormatter(labels))
...
... # Scalar formatter
... setup(axs1[4], title="ScalarFormatter()")
... axs1[4].xaxis.set_major_formatter(ticker.ScalarFormatter(useMathText=True))
...
... # FormatStr formatter
... setup(axs1[5], title="FormatStrFormatter('#%d')")
... axs1[5].xaxis.set_major_formatter(ticker.FormatStrFormatter("#%d"))
...
... # Percent formatter
... setup(axs1[6], title="PercentFormatter(xmax=5)")
... axs1[6].xaxis.set_major_formatter(ticker.PercentFormatter(xmax=5))
...
... fig1.tight_layout()
... plt.show()
...
...
... #############################################################################
... #
... # .. admonition:: References
... #
... # The use of the following functions, methods, classes and modules is shown
... # in this example:
... #
... # - `matplotlib.pyplot.subplots`
... # - `matplotlib.axes.Axes.text`
... # - `matplotlib.axis.Axis.set_major_formatter`
... # - `matplotlib.axis.Axis.set_major_locator`
... # - `matplotlib.axis.Axis.set_minor_locator`
... # - `matplotlib.axis.XAxis.set_ticks_position`
... # - `matplotlib.axis.YAxis.set_ticks_position`
... # - `matplotlib.ticker.FixedFormatter`
... # - `matplotlib.ticker.FixedLocator`
... # - `matplotlib.ticker.FormatStrFormatter`
... # - `matplotlib.ticker.FuncFormatter`
... # - `matplotlib.ticker.MultipleLocator`
... # - `matplotlib.ticker.NullFormatter`
... # - `matplotlib.ticker.NullLocator`
... # - `matplotlib.ticker.PercentFormatter`
... # - `matplotlib.ticker.ScalarFormatter`
... # - `matplotlib.ticker.StrMethodFormatter`
...