>>> """
======================
Text annotations in 3D
======================
Demonstrates the placement of text annotations on a 3D plot.
Functionality shown:
- Using the text function with three types of 'zdir' values: None, an axis
name (ex. 'x'), or a direction tuple (ex. (1, 1, 0)).
- Using the text function with the color keyword.
- Using the text2D function to place text on a fixed position on the ax
object.
"""
...
... import matplotlib.pyplot as plt
...
...
... ax = plt.figure().add_subplot(projection='3d')
...
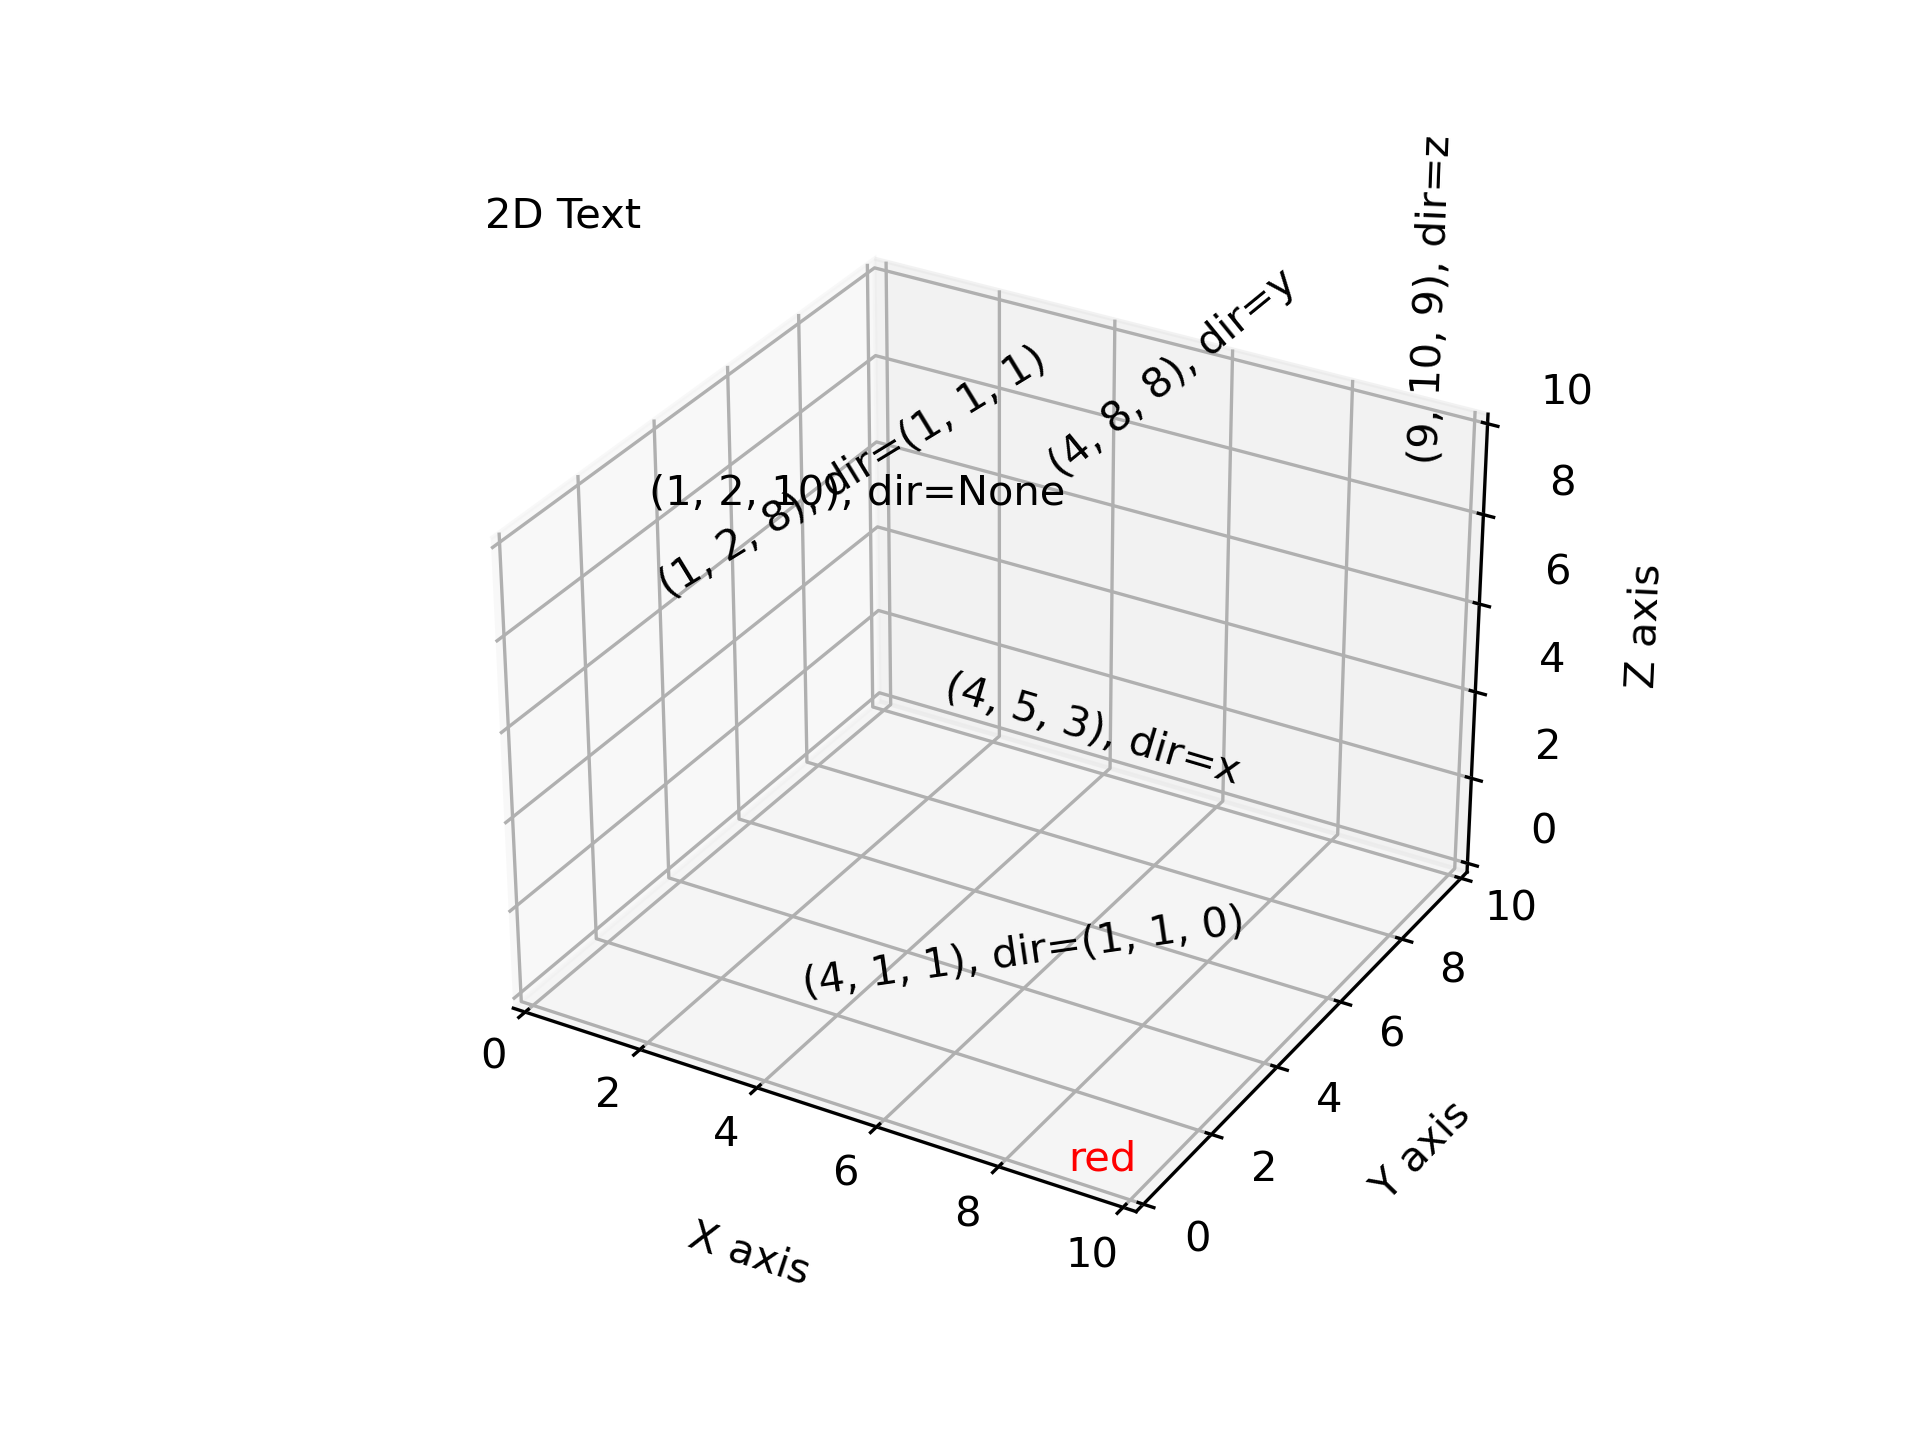
... # Demo 1: zdir
... zdirs = (None, 'x', 'y', 'z', (1, 1, 0), (1, 1, 1))
... xs = (1, 4, 4, 9, 4, 1)
... ys = (2, 5, 8, 10, 1, 2)
... zs = (10, 3, 8, 9, 1, 8)
...
... for zdir, x, y, z in zip(zdirs, xs, ys, zs):
... label = '(%d, %d, %d), dir=%s' % (x, y, z, zdir)
... ax.text(x, y, z, label, zdir)
...
... # Demo 2: color
... ax.text(9, 0, 0, "red", color='red')
...
... # Demo 3: text2D
... # Placement 0, 0 would be the bottom left, 1, 1 would be the top right.
... ax.text2D(0.05, 0.95, "2D Text", transform=ax.transAxes)
...
... # Tweaking display region and labels
... ax.set_xlim(0, 10)
... ax.set_ylim(0, 10)
... ax.set_zlim(0, 10)
... ax.set_xlabel('X axis')
... ax.set_ylabel('Y axis')
... ax.set_zlabel('Z axis')
...
... plt.show()
...