>>>
... """
===========
Symlog Demo
===========
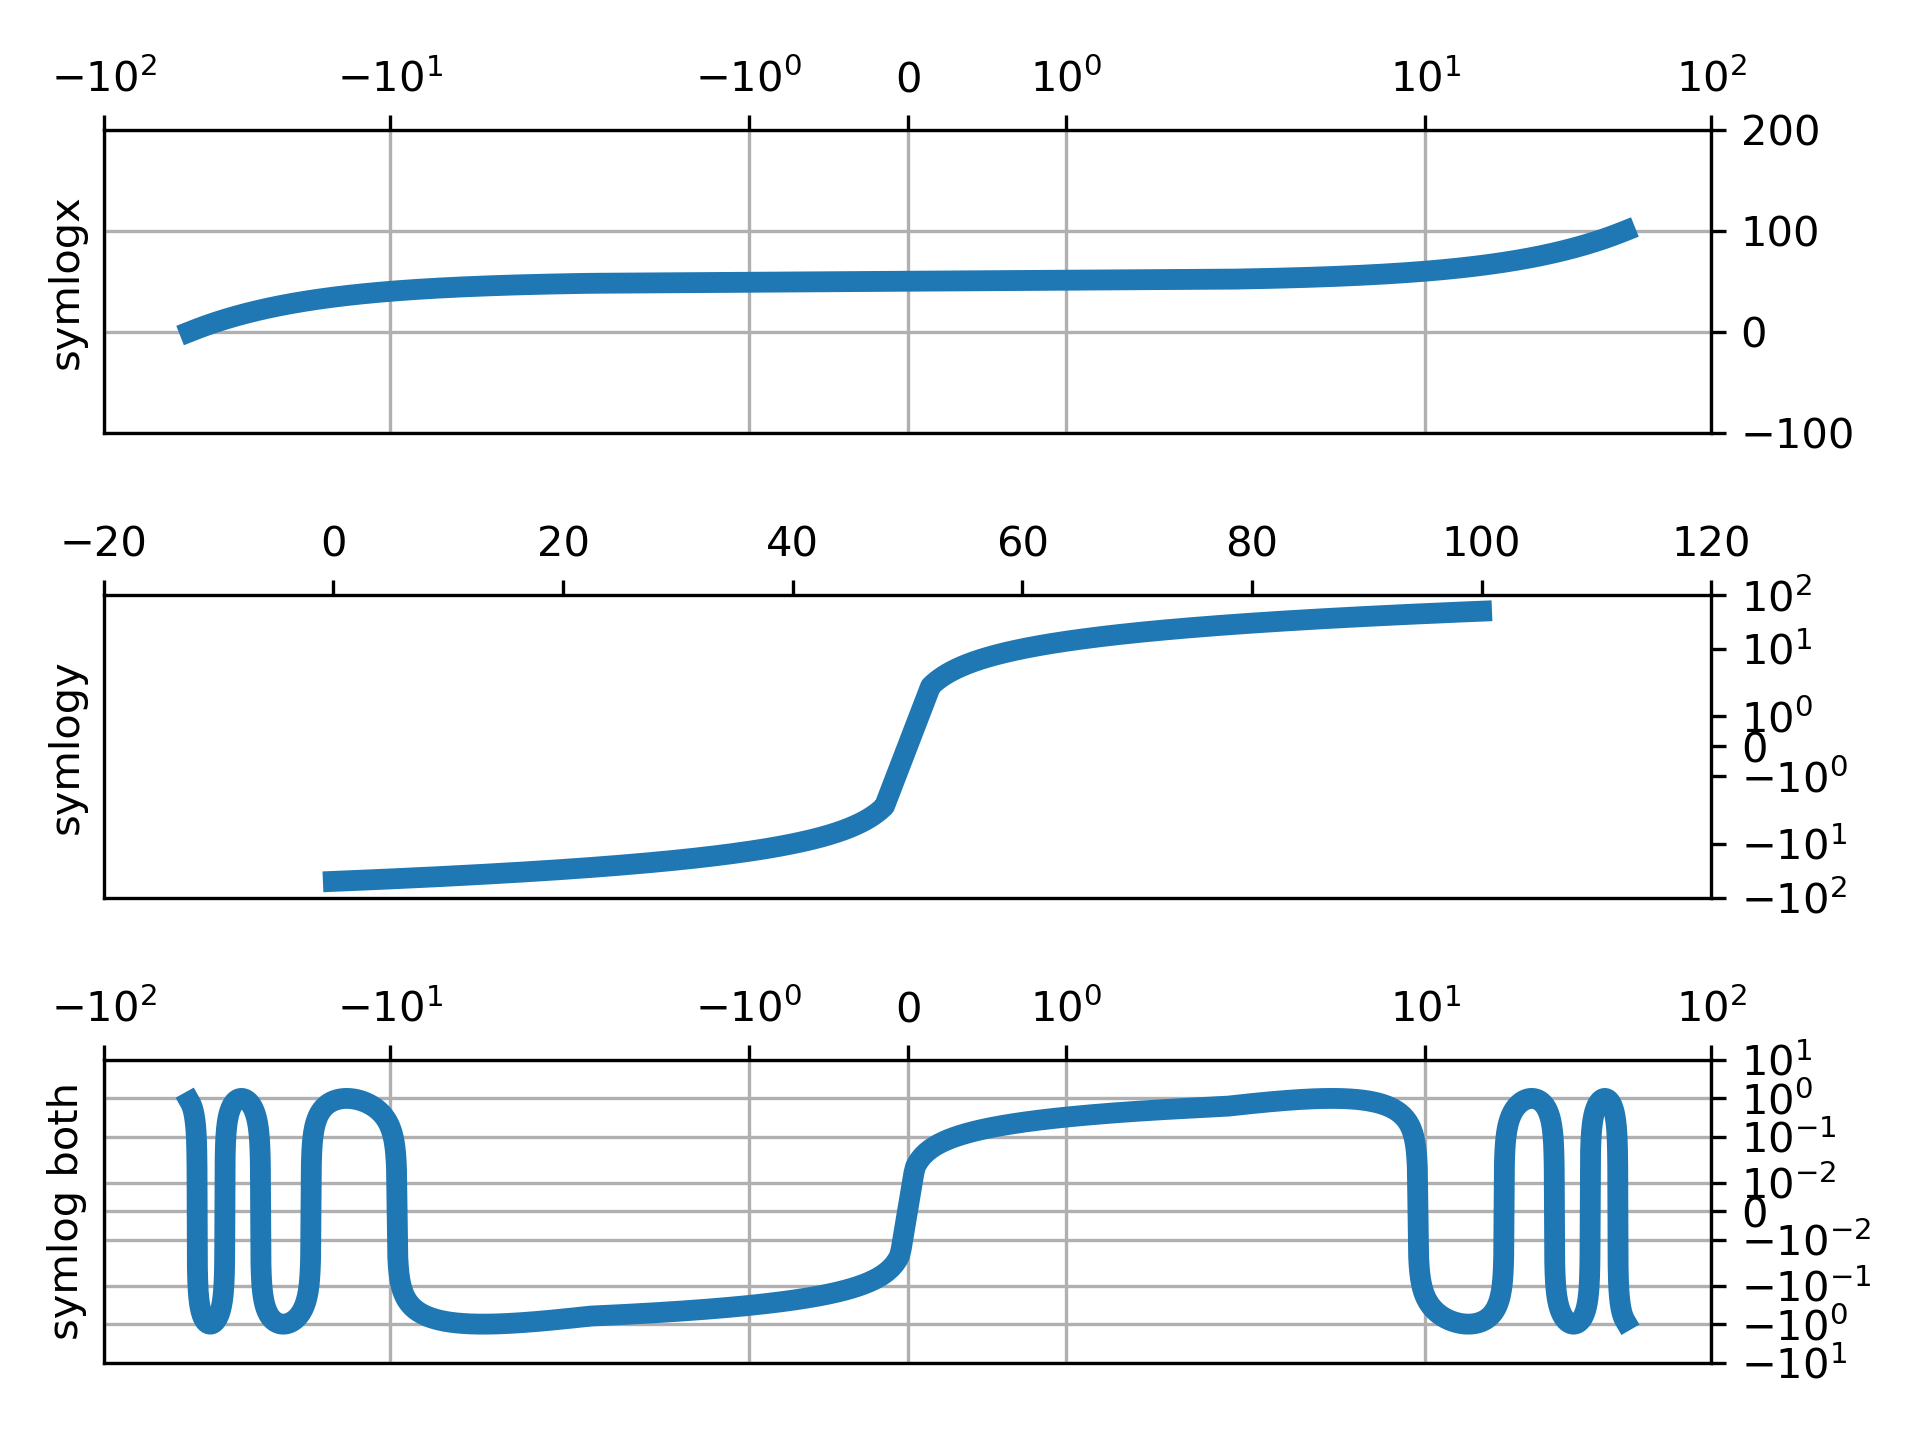
Example use of symlog (symmetric log) axis scaling.
"""
... import matplotlib.pyplot as plt
... import numpy as np
...
... dt = 0.01
... x = np.arange(-50.0, 50.0, dt)
... y = np.arange(0, 100.0, dt)
...
... fig, (ax0, ax1, ax2) = plt.subplots(nrows=3)
...
... ax0.plot(x, y)
... ax0.set_xscale('symlog')
... ax0.set_ylabel('symlogx')
... ax0.grid()
... ax0.xaxis.grid(which='minor') # minor grid on too
...
... ax1.plot(y, x)
... ax1.set_yscale('symlog')
... ax1.set_ylabel('symlogy')
...
... ax2.plot(x, np.sin(x / 3.0))
... ax2.set_xscale('symlog')
... ax2.set_yscale('symlog', linthresh=0.015)
... ax2.grid()
... ax2.set_ylabel('symlog both')
...
... fig.tight_layout()
... plt.show()