>>> """
==============
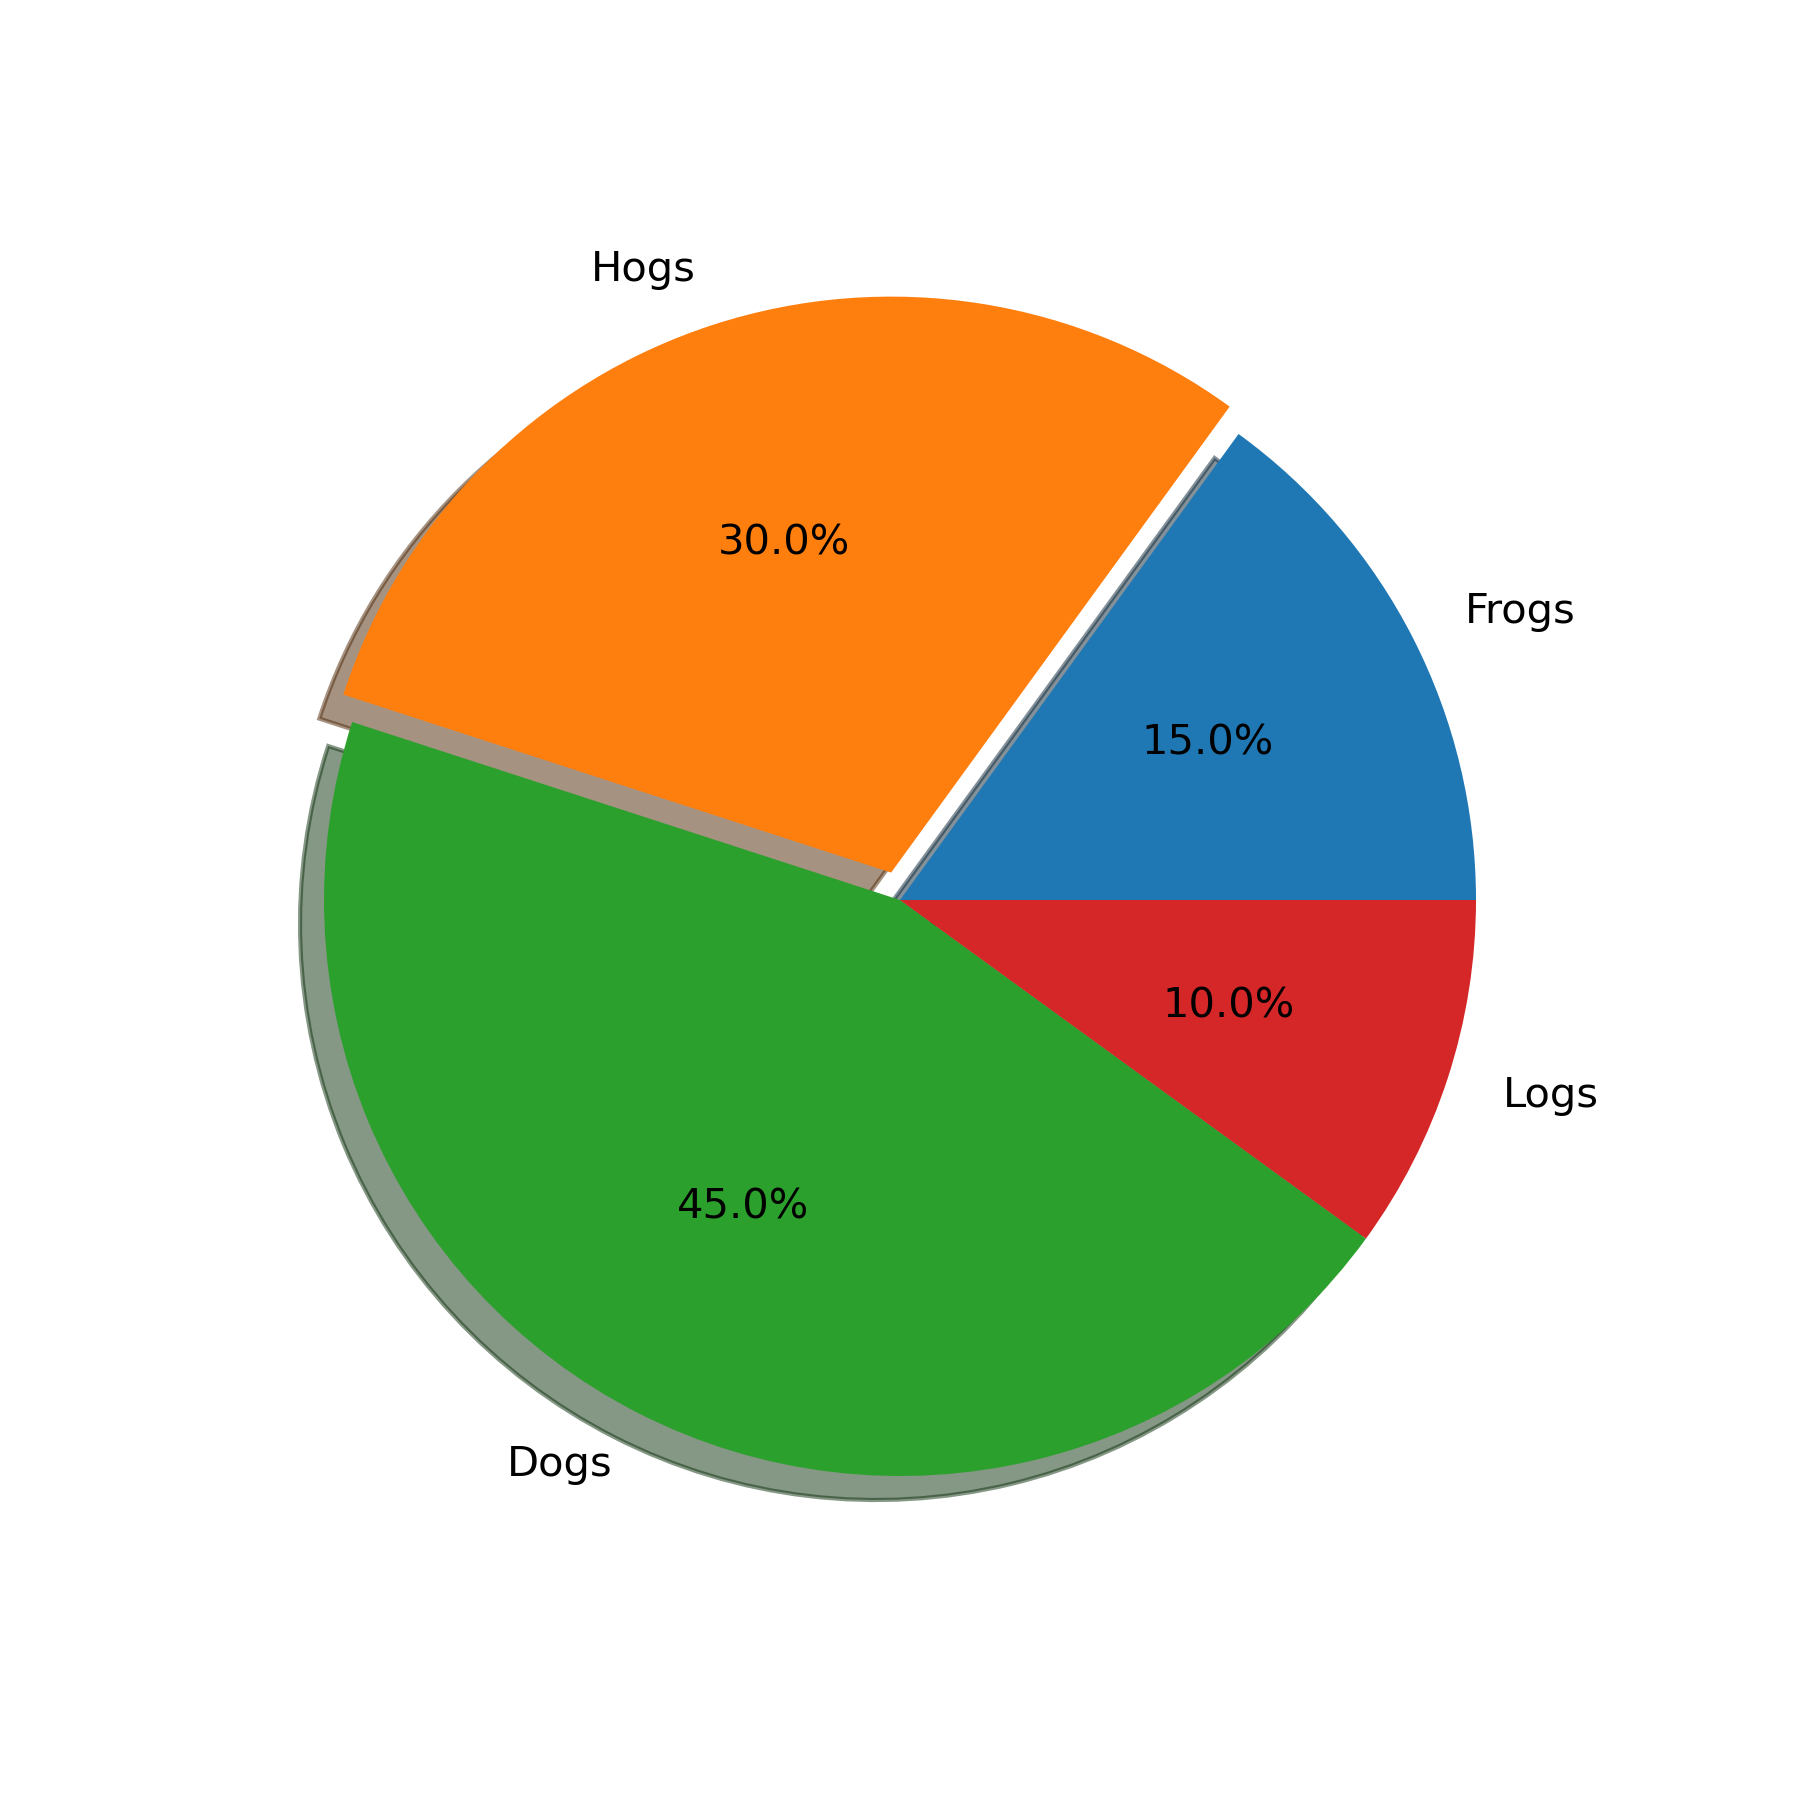
SVG Filter Pie
==============
Demonstrate SVG filtering effects which might be used with Matplotlib.
The pie chart drawing code is borrowed from pie_demo.py
Note that the filtering effects are only effective if your SVG renderer
support it.
"""
...
... import io
... import xml.etree.ElementTree as ET
...
... import matplotlib.pyplot as plt
... from matplotlib.patches import Shadow
...
... # make a square figure and axes
... fig = plt.figure(figsize=(6, 6))
... ax = fig.add_axes([0.1, 0.1, 0.8, 0.8])
...
... labels = 'Frogs', 'Hogs', 'Dogs', 'Logs'
... fracs = [15, 30, 45, 10]
...
... explode = (0, 0.05, 0, 0)
...
... # We want to draw the shadow for each pie but we will not use "shadow"
... # option as it doesn't save the references to the shadow patches.
... pies = ax.pie(fracs, explode=explode, labels=labels, autopct='%1.1f%%')
...
... for w in pies[0]:
... # set the id with the label.
... w.set_gid(w.get_label())
...
... # we don't want to draw the edge of the pie
... w.set_edgecolor("none")
...
... for w in pies[0]:
... # create shadow patch
... s = Shadow(w, -0.01, -0.01)
... s.set_gid(w.get_gid() + "_shadow")
... s.set_zorder(w.get_zorder() - 0.1)
... ax.add_patch(s)
...
...
... # save
... f = io.BytesIO()
... plt.savefig(f, format="svg")
...
...
... # Filter definition for shadow using a gaussian blur and lighting effect.
... # The lighting filter is copied from http://www.w3.org/TR/SVG/filters.html
...
... # I tested it with Inkscape and Firefox3. "Gaussian blur" is supported
... # in both, but the lighting effect only in Inkscape. Also note
... # that, Inkscape's exporting also may not support it.
...
... filter_def = """
... <defs xmlns='http://www.w3.org/2000/svg'
... xmlns:xlink='http://www.w3.org/1999/xlink'>
... <filter id='dropshadow' height='1.2' width='1.2'>
... <feGaussianBlur result='blur' stdDeviation='2'/>
... </filter>
...
... <filter id='MyFilter' filterUnits='objectBoundingBox'
... x='0' y='0' width='1' height='1'>
... <feGaussianBlur in='SourceAlpha' stdDeviation='4%' result='blur'/>
... <feOffset in='blur' dx='4%' dy='4%' result='offsetBlur'/>
... <feSpecularLighting in='blur' surfaceScale='5' specularConstant='.75'
... specularExponent='20' lighting-color='#bbbbbb' result='specOut'>
... <fePointLight x='-5000%' y='-10000%' z='20000%'/>
... </feSpecularLighting>
... <feComposite in='specOut' in2='SourceAlpha'
... operator='in' result='specOut'/>
... <feComposite in='SourceGraphic' in2='specOut' operator='arithmetic'
... k1='0' k2='1' k3='1' k4='0'/>
... </filter>
... </defs>
... """
...
...
... tree, xmlid = ET.XMLID(f.getvalue())
...
... # insert the filter definition in the svg dom tree.
... tree.insert(0, ET.XML(filter_def))
...
... for i, pie_name in enumerate(labels):
... pie = xmlid[pie_name]
... pie.set("filter", 'url(#MyFilter)')
...
... shadow = xmlid[pie_name + "_shadow"]
... shadow.set("filter", 'url(#dropshadow)')
...
... fn = "svg_filter_pie.svg"
... print(f"Saving '{fn}'")
... ET.ElementTree(tree).write(fn)
...