>>> """
=================================================
Creating multiple subplots using ``plt.subplots``
=================================================
`.pyplot.subplots` creates a figure and a grid of subplots with a single call,
while providing reasonable control over how the individual plots are created.
For more advanced use cases you can use `.GridSpec` for a more general subplot
layout or `.Figure.add_subplot` for adding subplots at arbitrary locations
within the figure.
"""
...
... # sphinx_gallery_thumbnail_number = 11
...
... import matplotlib.pyplot as plt
... import numpy as np
...
... # Some example data to display
... x = np.linspace(0, 2 * np.pi, 400)
... y = np.sin(x ** 2)
...
... ###############################################################################
... # A figure with just one subplot
... # """"""""""""""""""""""""""""""
... #
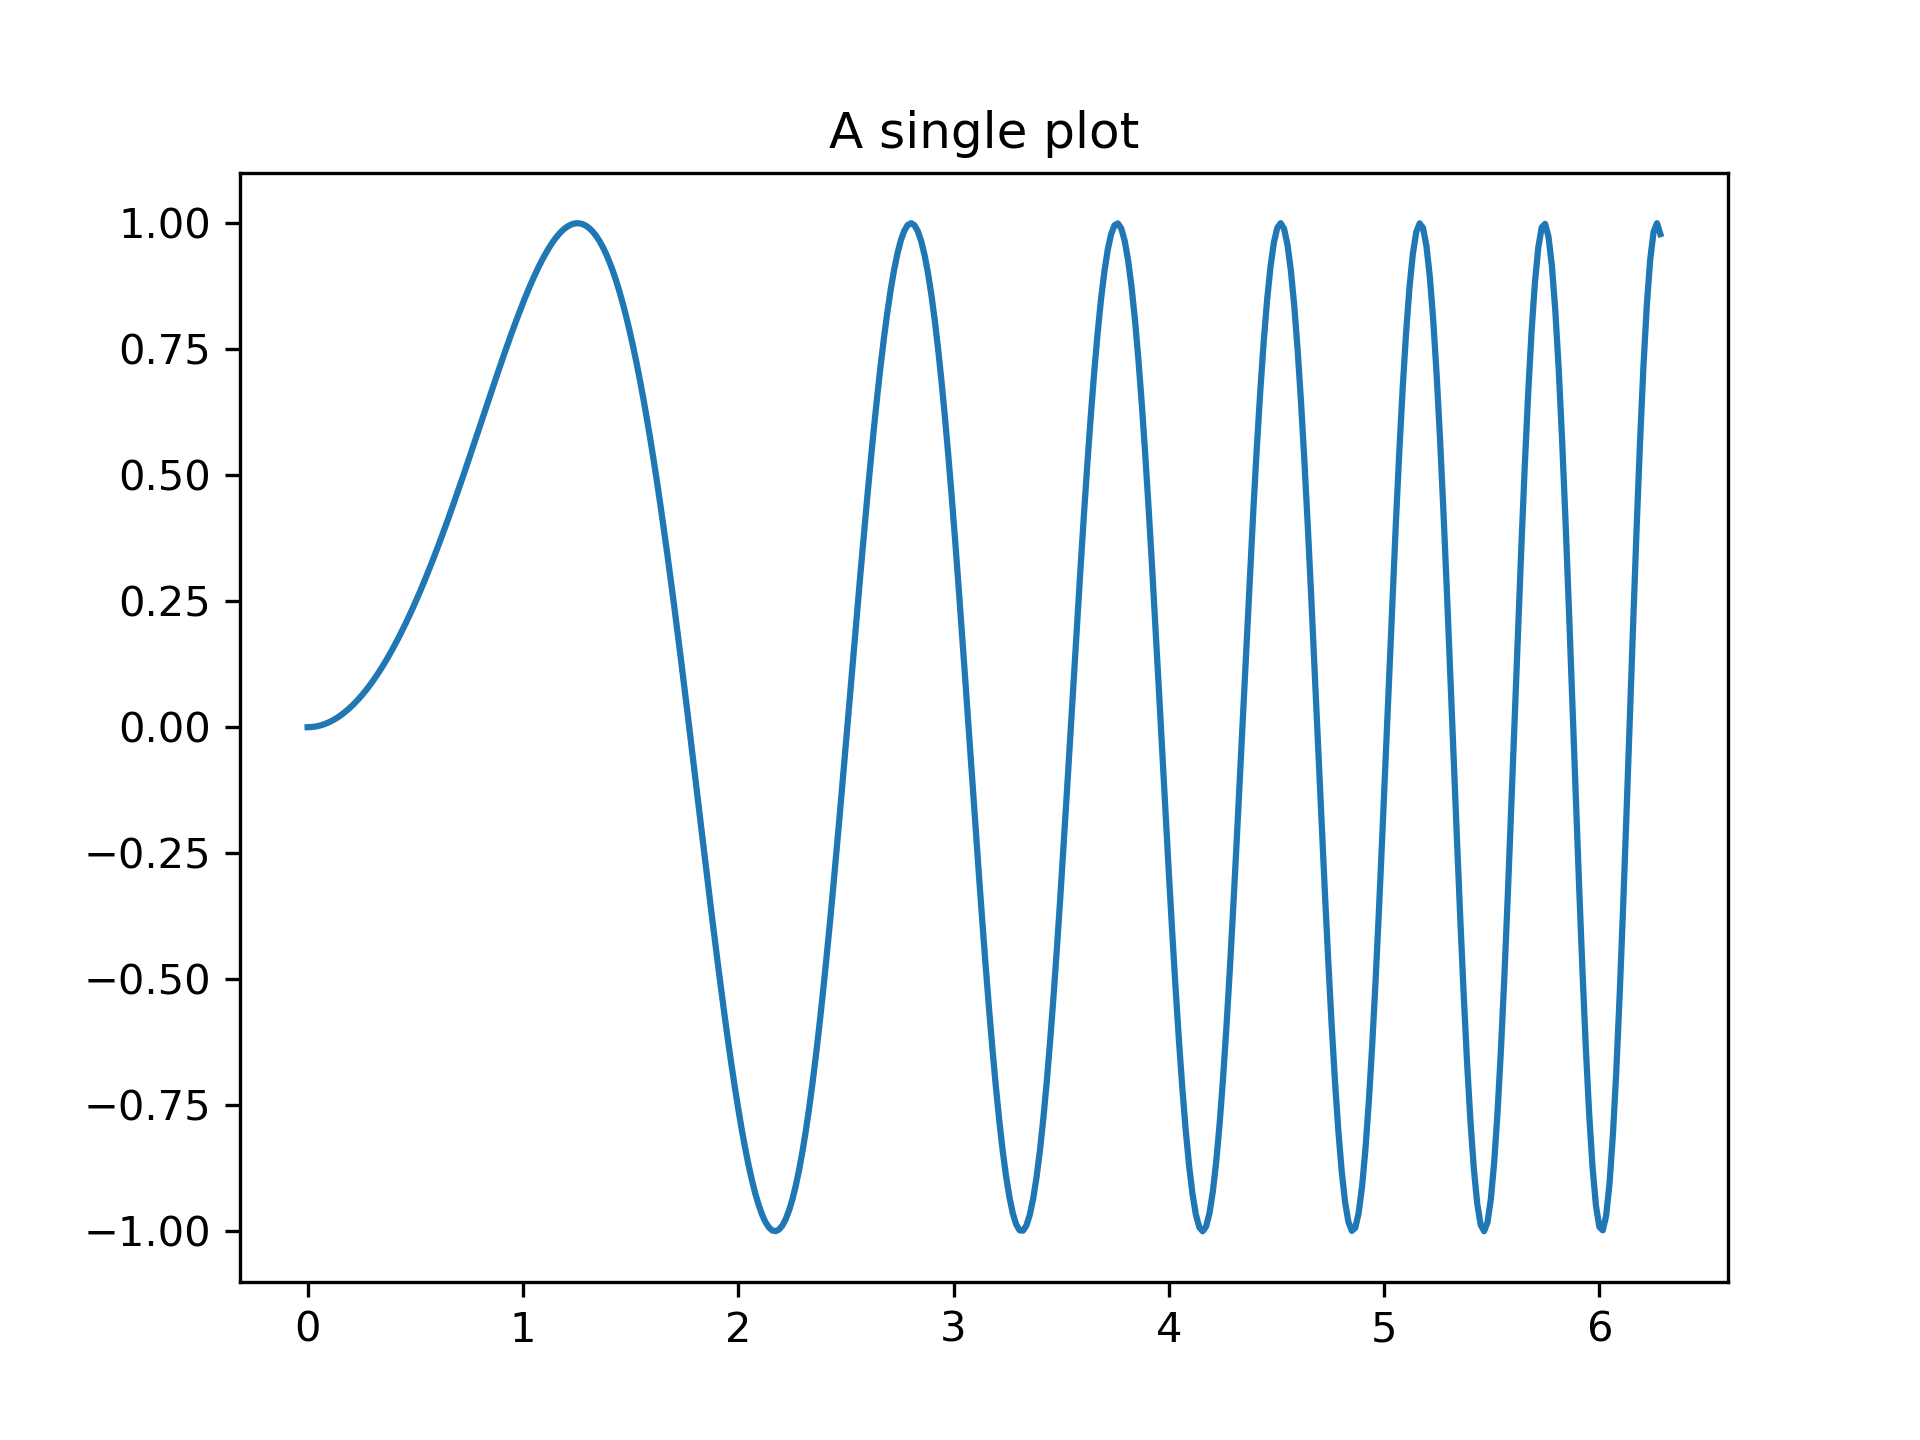
... # ``subplots()`` without arguments returns a `.Figure` and a single
... # `~.axes.Axes`.
... #
... # This is actually the simplest and recommended way of creating a single
... # Figure and Axes.
...
... fig, ax = plt.subplots()
... ax.plot(x, y)
... ax.set_title('A single plot')
...
... ###############################################################################
... # Stacking subplots in one direction
... # """"""""""""""""""""""""""""""""""
... #
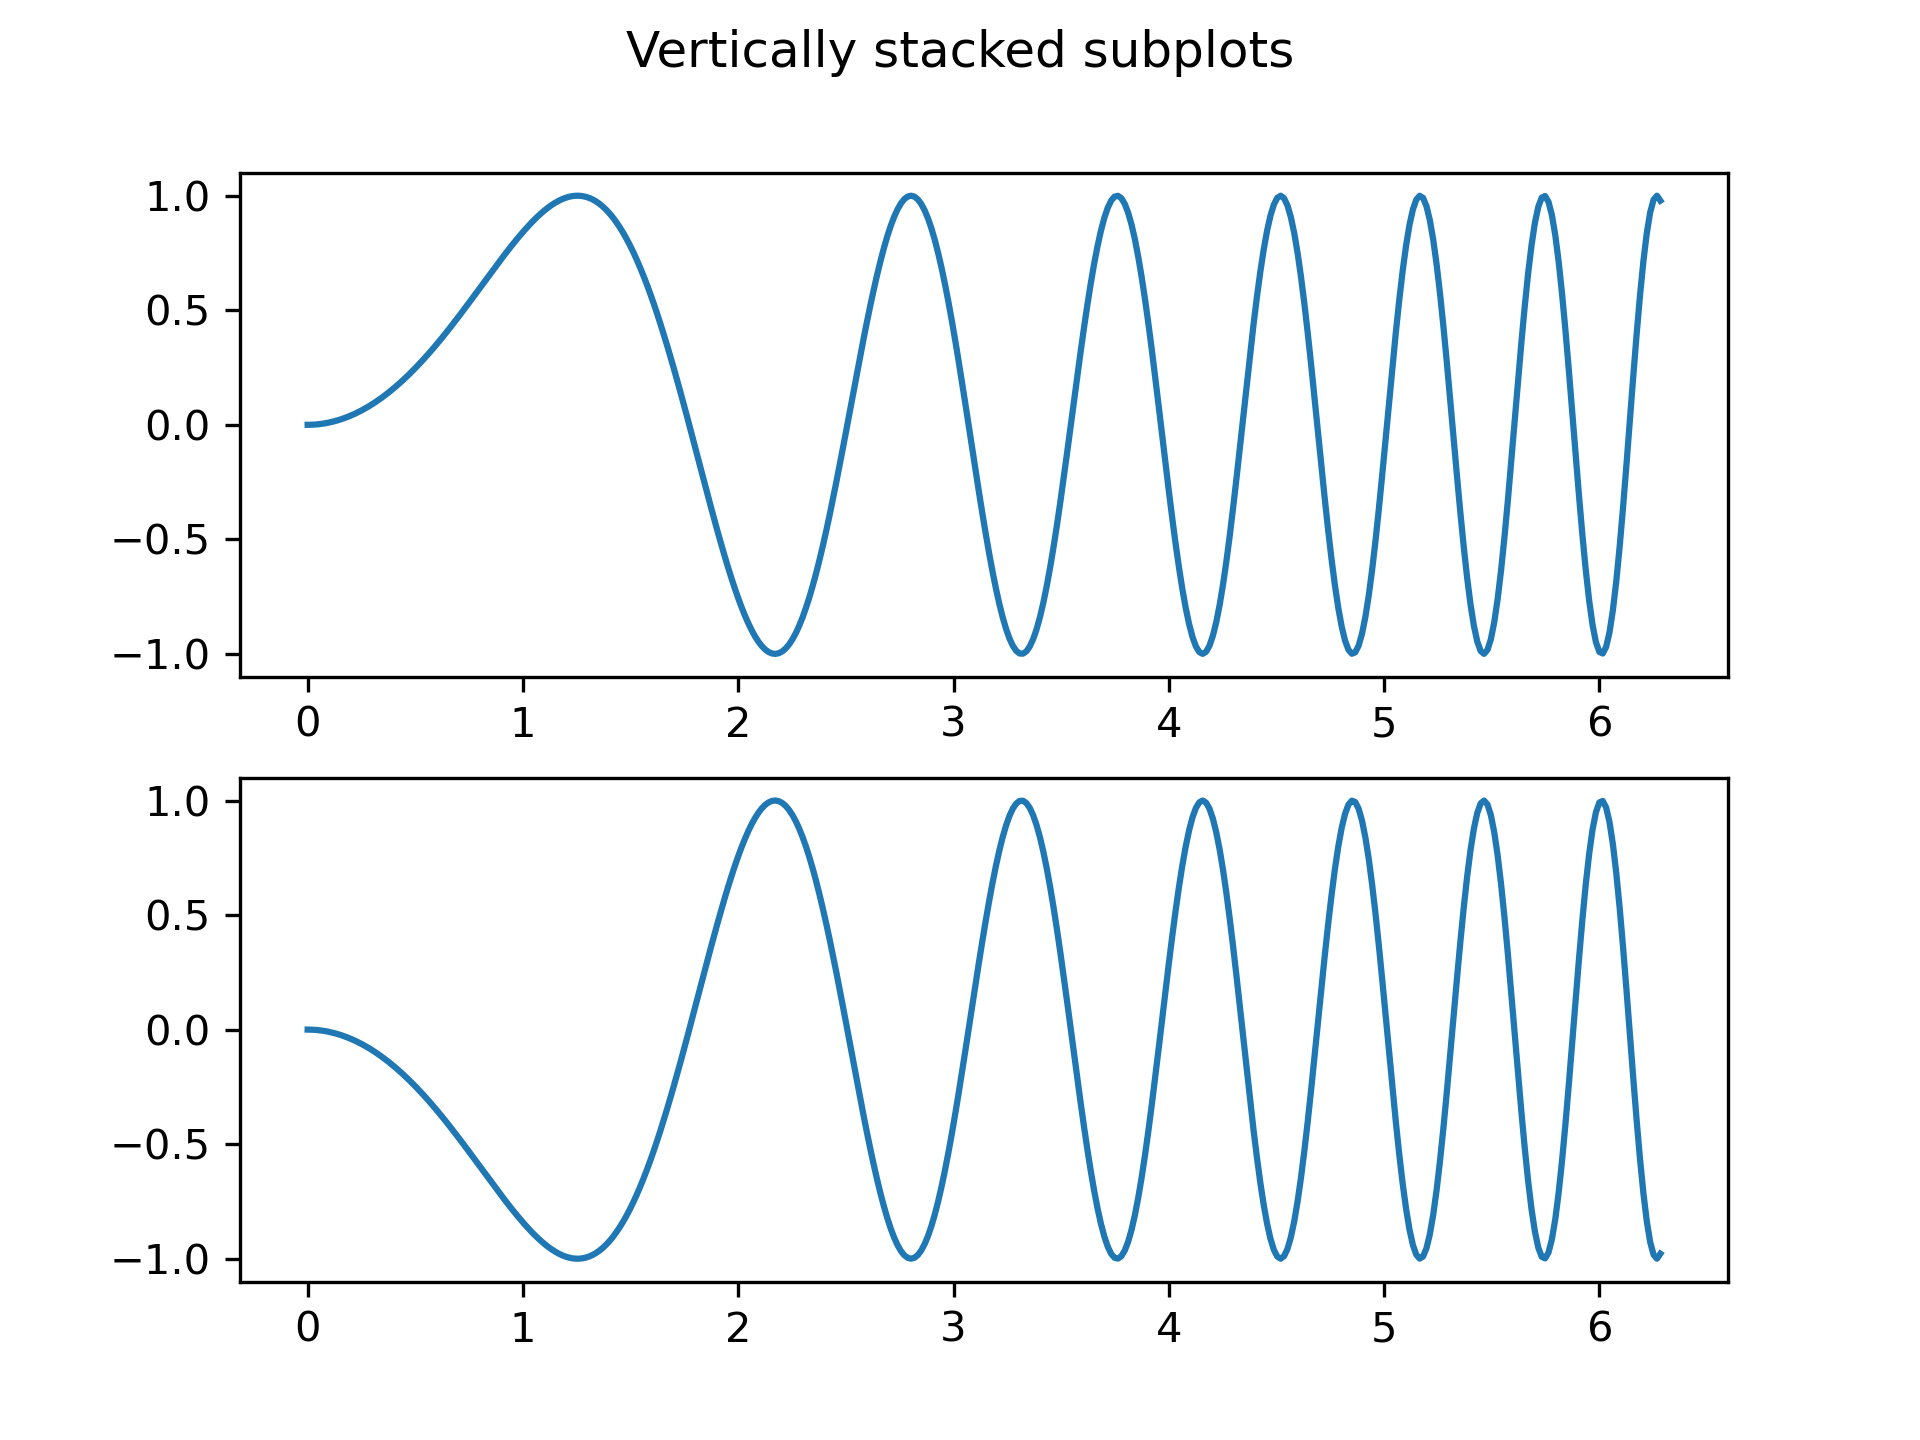
... # The first two optional arguments of `.pyplot.subplots` define the number of
... # rows and columns of the subplot grid.
... #
... # When stacking in one direction only, the returned ``axs`` is a 1D numpy array
... # containing the list of created Axes.
...
... fig, axs = plt.subplots(2)
... fig.suptitle('Vertically stacked subplots')
... axs[0].plot(x, y)
... axs[1].plot(x, -y)
...
... ###############################################################################
... # If you are creating just a few Axes, it's handy to unpack them immediately to
... # dedicated variables for each Axes. That way, we can use ``ax1`` instead of
... # the more verbose ``axs[0]``.
...
... fig, (ax1, ax2) = plt.subplots(2)
... fig.suptitle('Vertically stacked subplots')
... ax1.plot(x, y)
... ax2.plot(x, -y)
...
... ###############################################################################
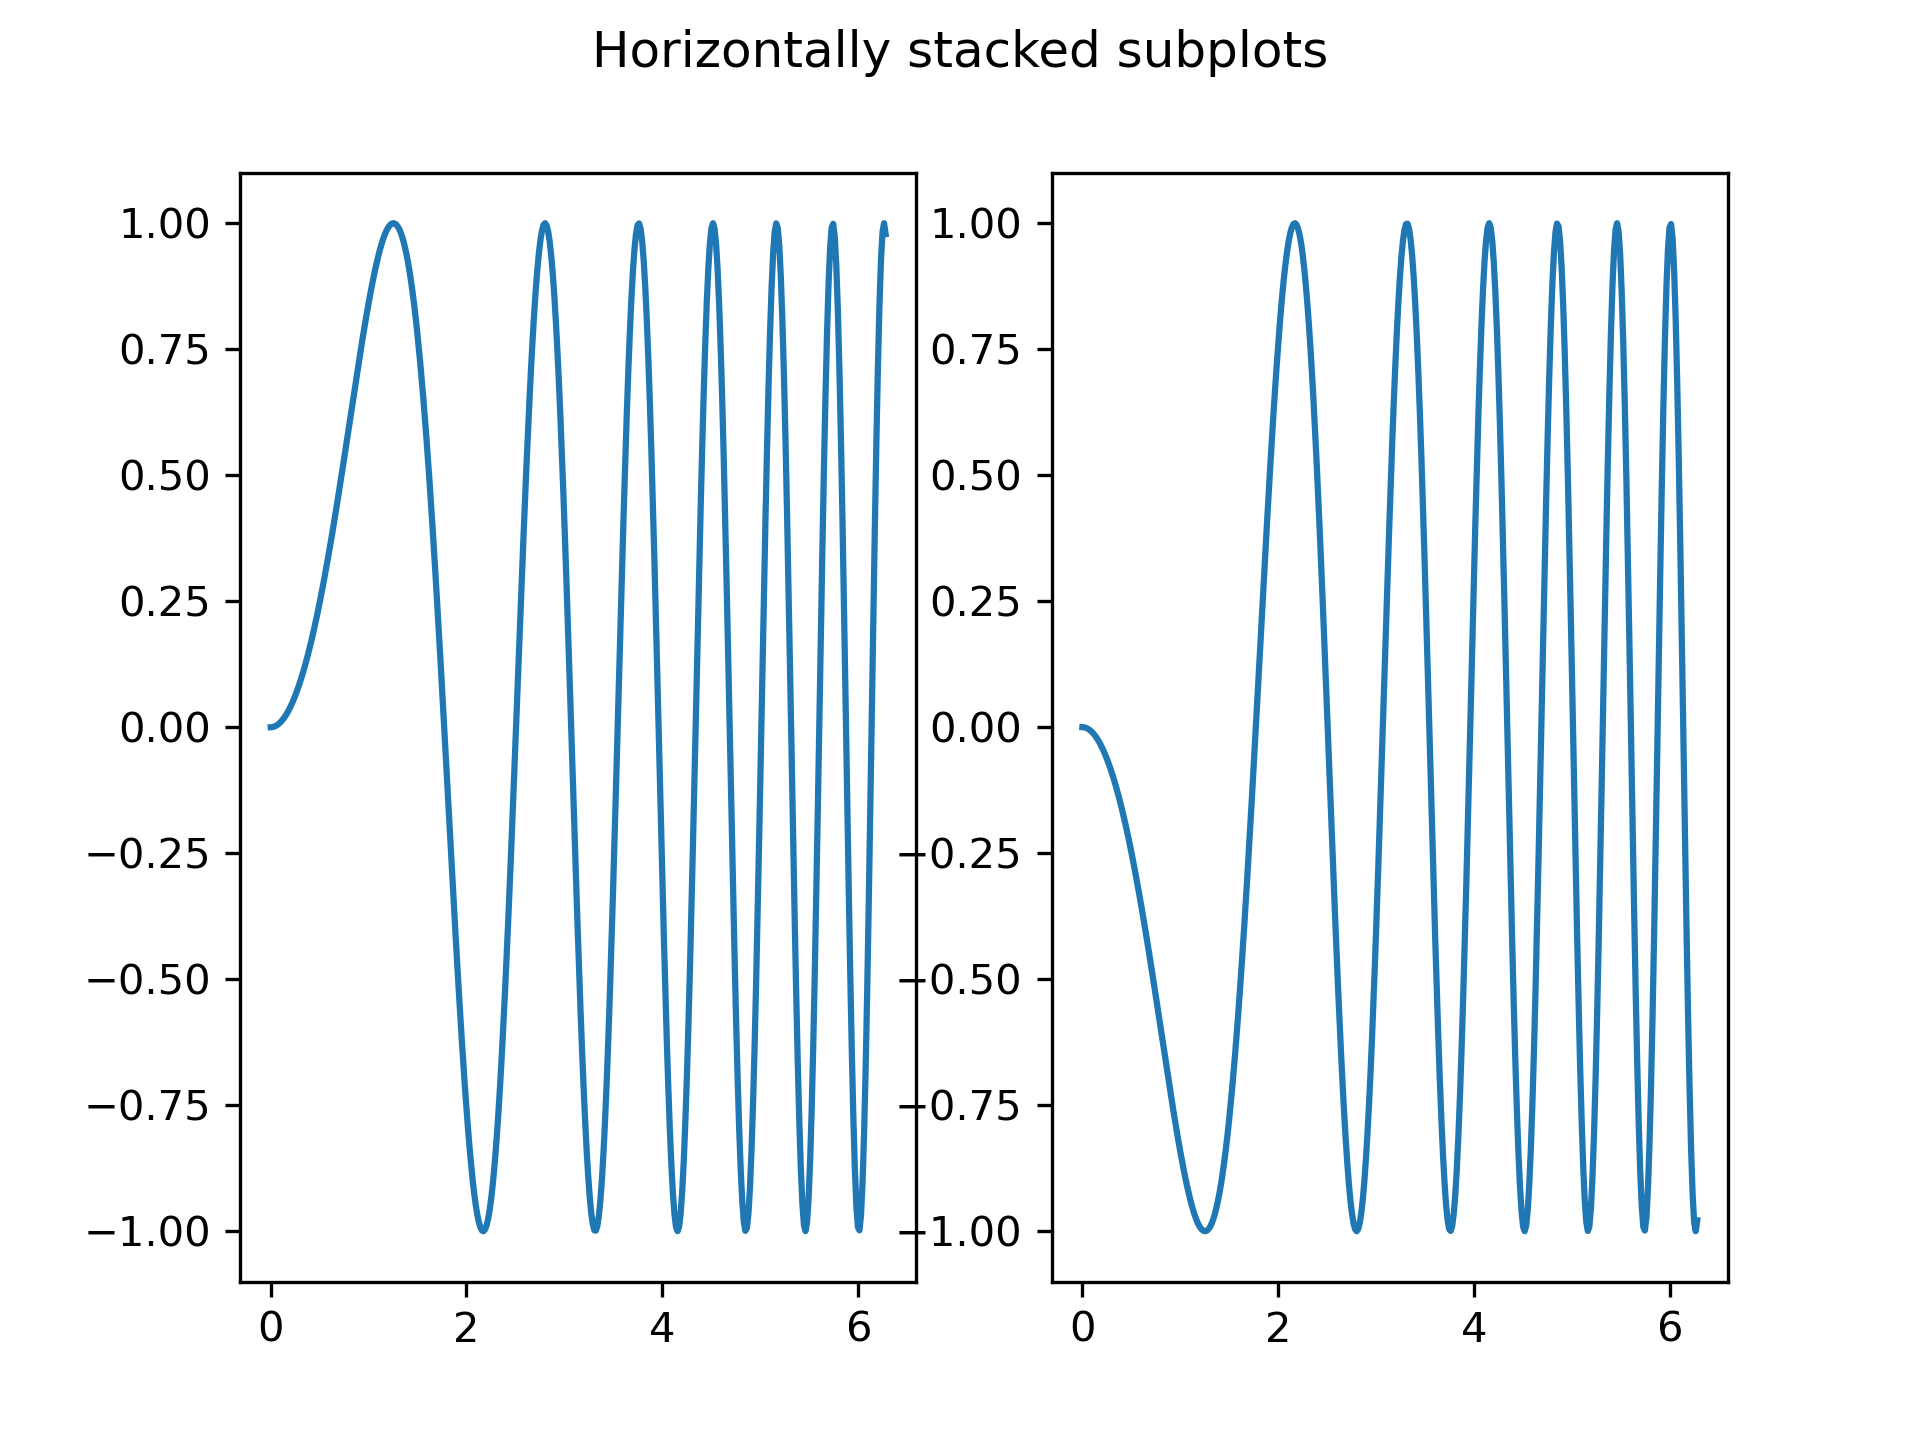
... # To obtain side-by-side subplots, pass parameters ``1, 2`` for one row and two
... # columns.
...
... fig, (ax1, ax2) = plt.subplots(1, 2)
... fig.suptitle('Horizontally stacked subplots')
... ax1.plot(x, y)
... ax2.plot(x, -y)
...
... ###############################################################################
... # Stacking subplots in two directions
... # """""""""""""""""""""""""""""""""""
... #
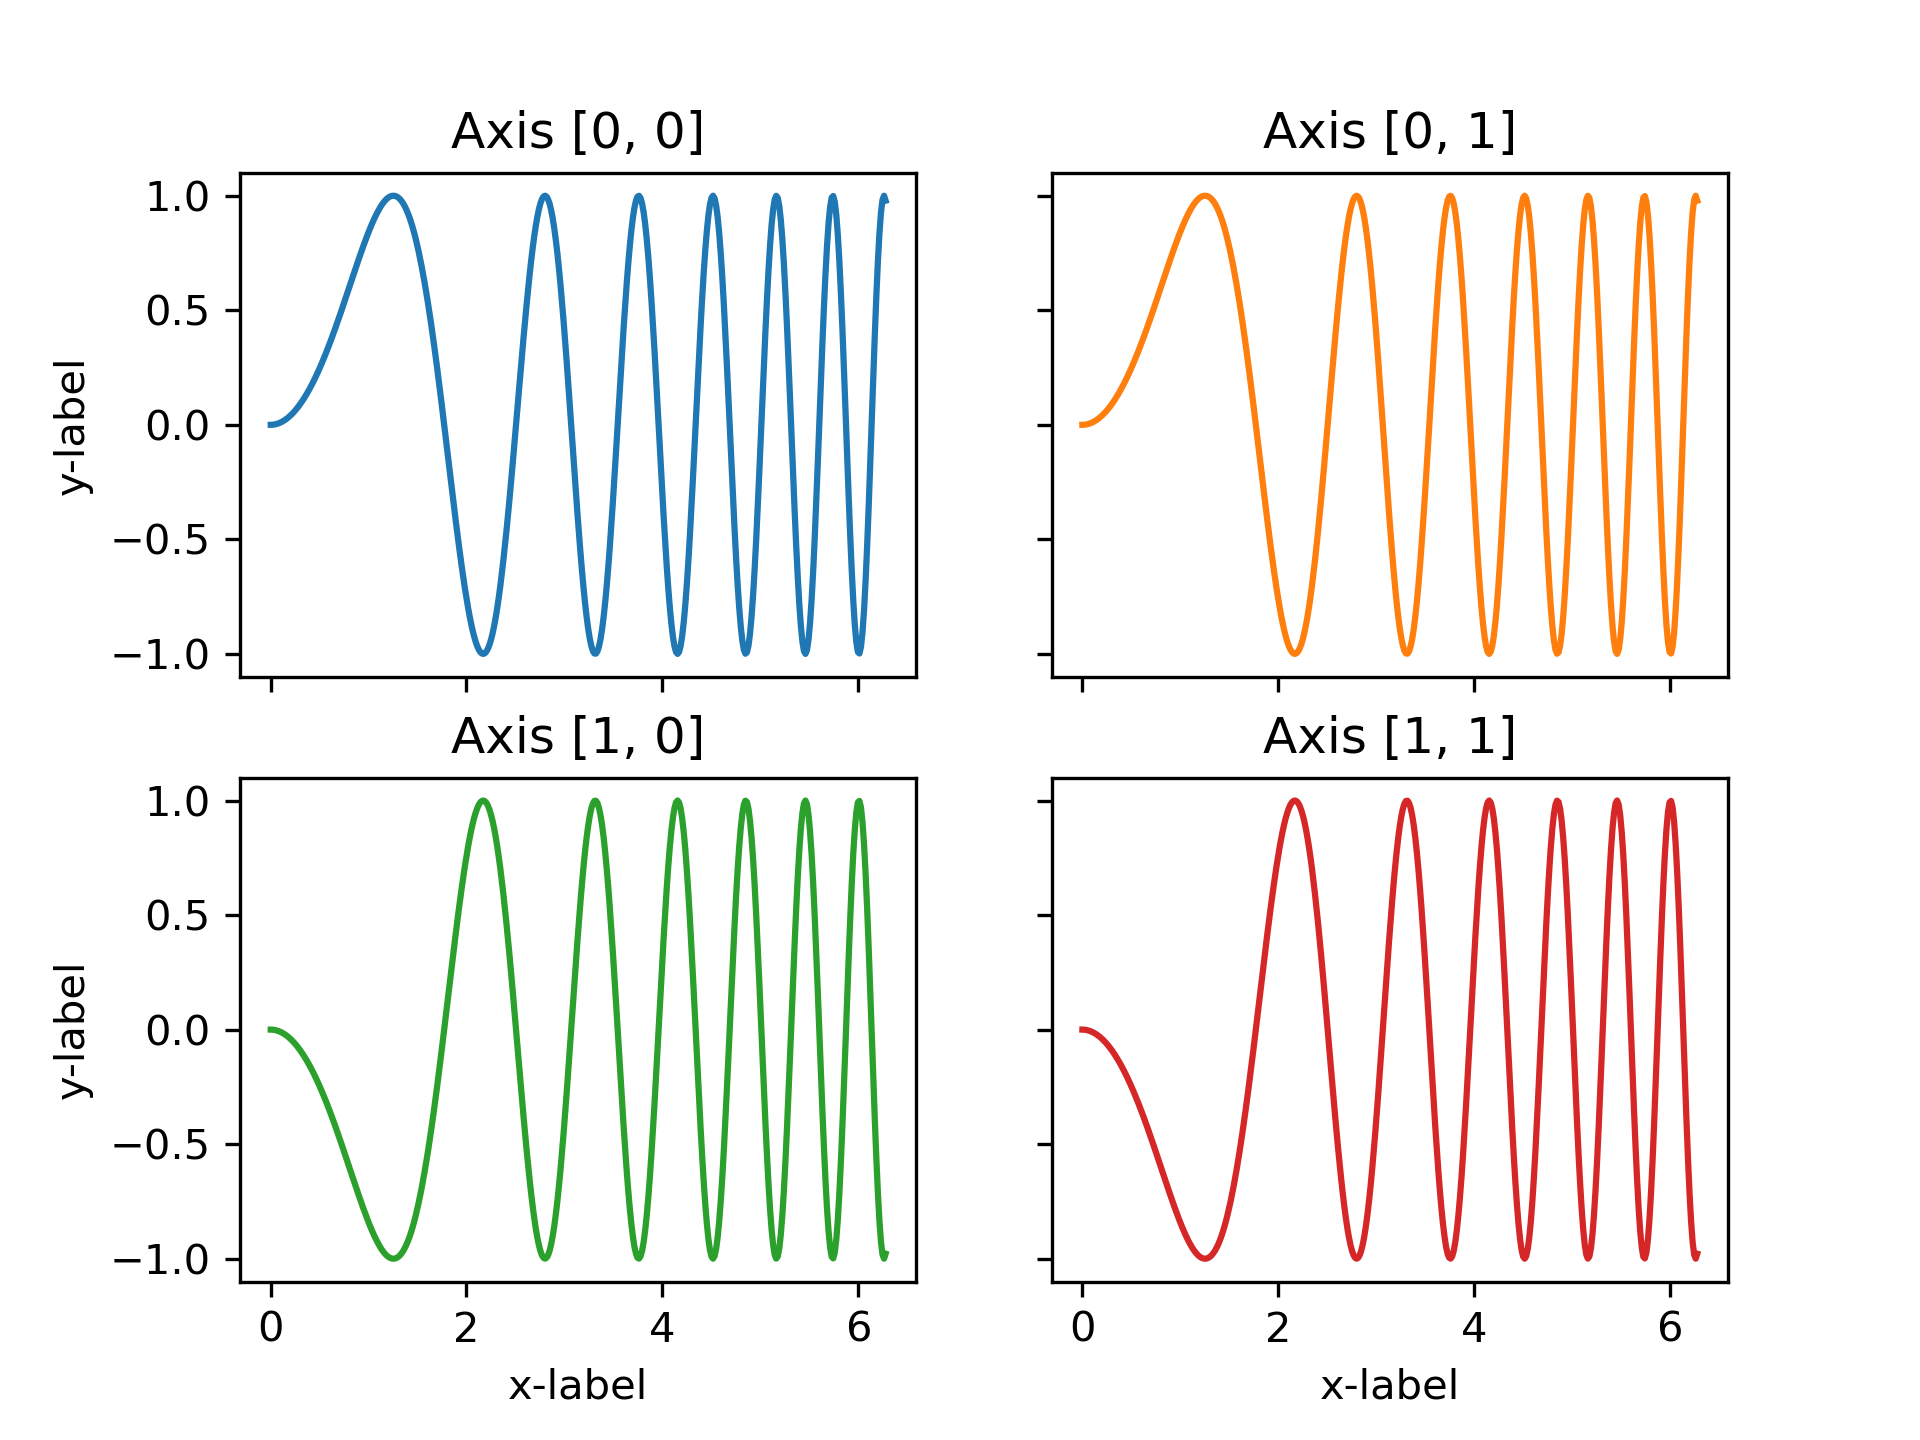
... # When stacking in two directions, the returned ``axs`` is a 2D NumPy array.
... #
... # If you have to set parameters for each subplot it's handy to iterate over
... # all subplots in a 2D grid using ``for ax in axs.flat:``.
...
... fig, axs = plt.subplots(2, 2)
... axs[0, 0].plot(x, y)
... axs[0, 0].set_title('Axis [0, 0]')
... axs[0, 1].plot(x, y, 'tab:orange')
... axs[0, 1].set_title('Axis [0, 1]')
... axs[1, 0].plot(x, -y, 'tab:green')
... axs[1, 0].set_title('Axis [1, 0]')
... axs[1, 1].plot(x, -y, 'tab:red')
... axs[1, 1].set_title('Axis [1, 1]')
...
... for ax in axs.flat:
... ax.set(xlabel='x-label', ylabel='y-label')
...
... # Hide x labels and tick labels for top plots and y ticks for right plots.
... for ax in axs.flat:
... ax.label_outer()
...
... ###############################################################################
... # You can use tuple-unpacking also in 2D to assign all subplots to dedicated
... # variables:
...
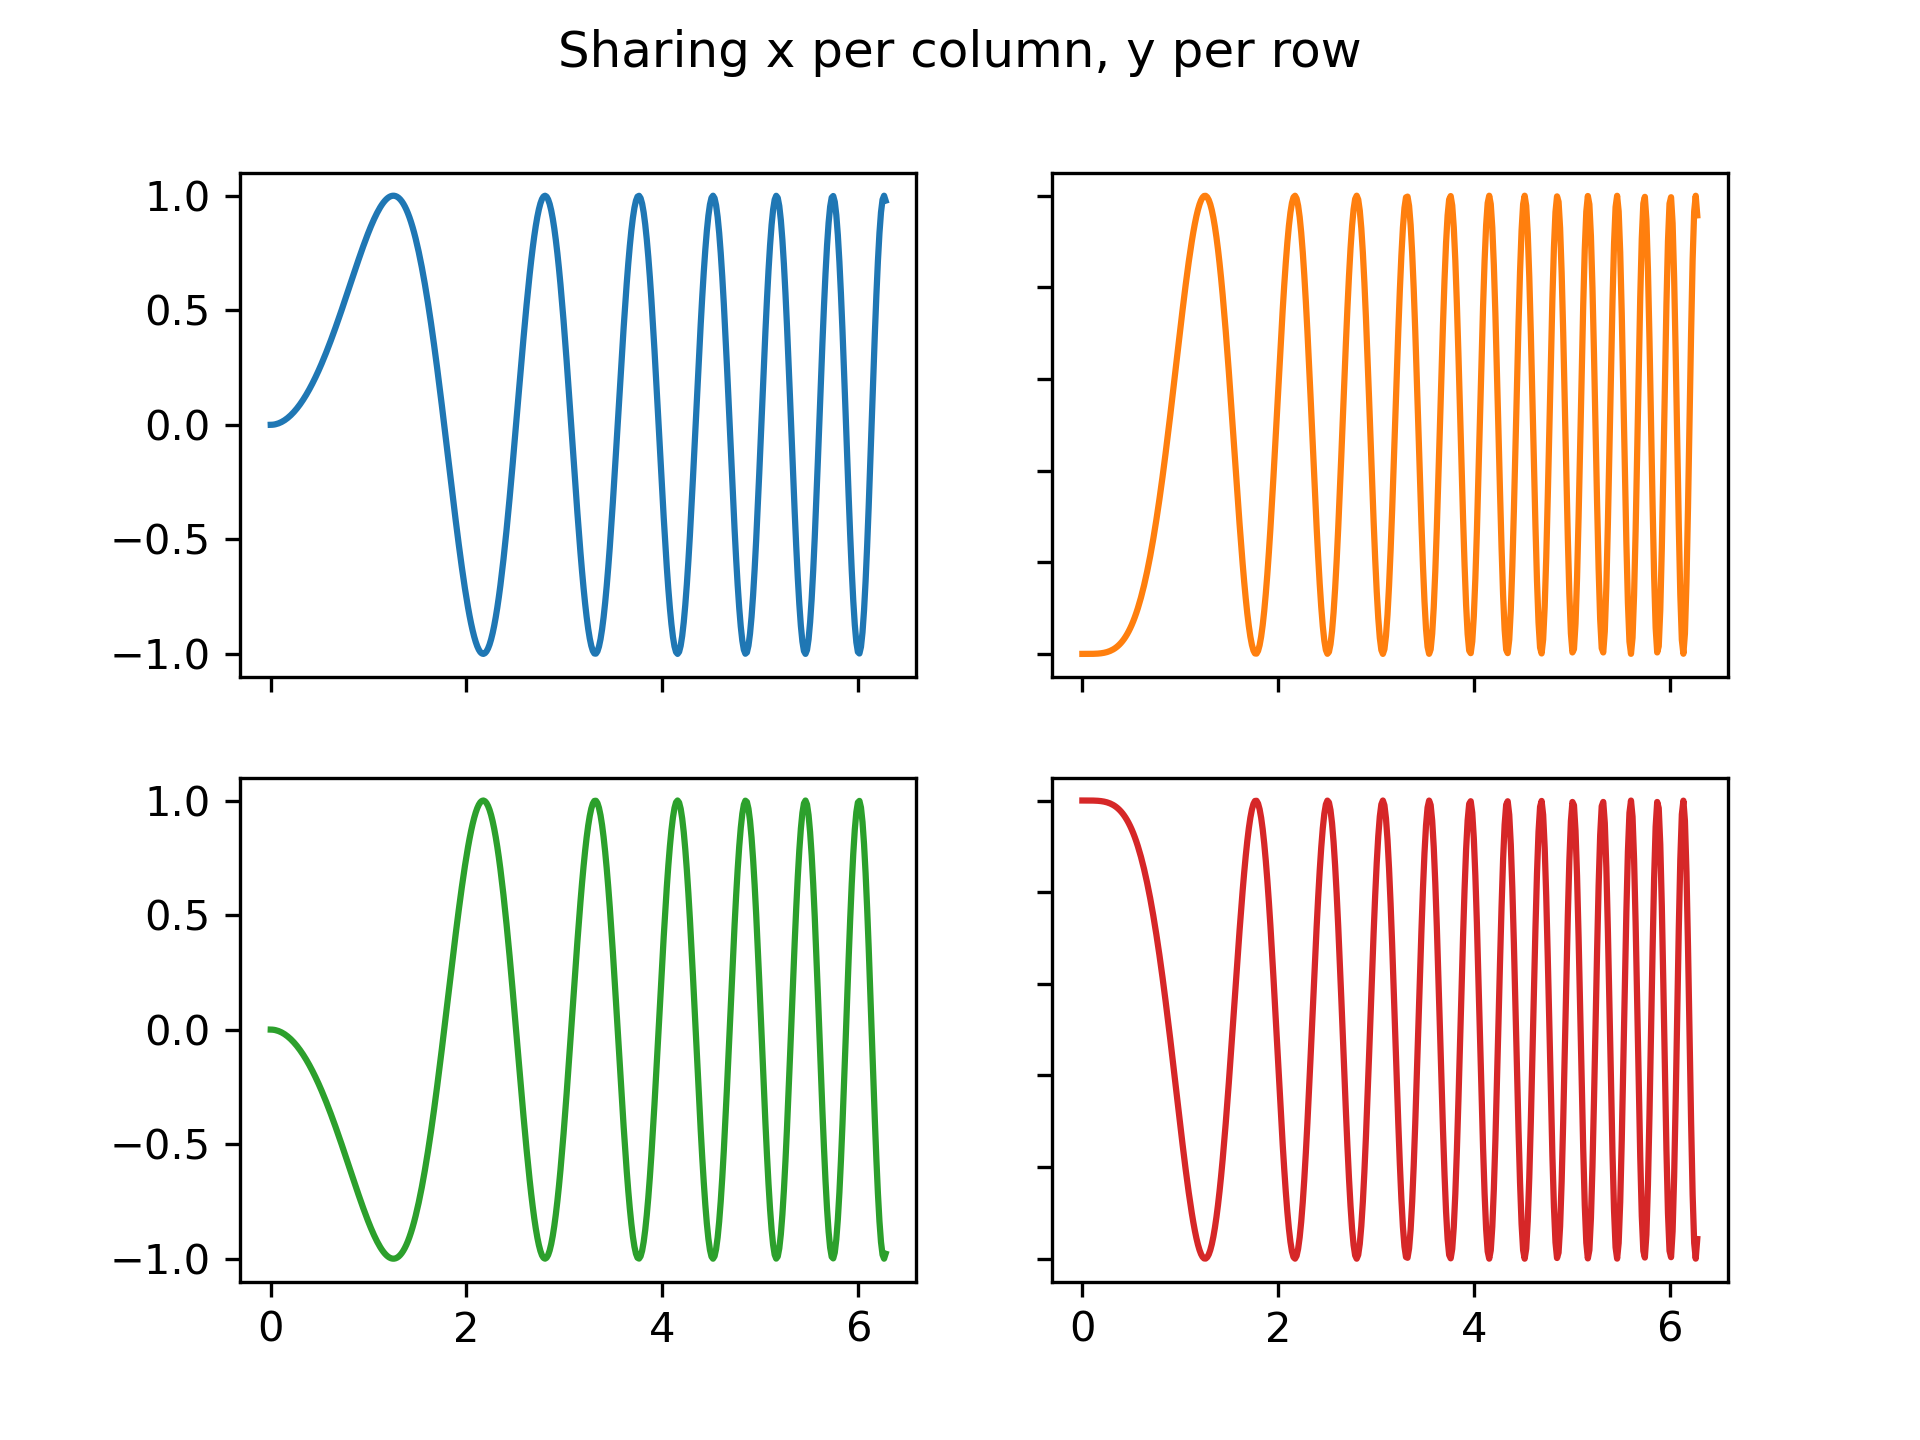
... fig, ((ax1, ax2), (ax3, ax4)) = plt.subplots(2, 2)
... fig.suptitle('Sharing x per column, y per row')
... ax1.plot(x, y)
... ax2.plot(x, y**2, 'tab:orange')
... ax3.plot(x, -y, 'tab:green')
... ax4.plot(x, -y**2, 'tab:red')
...
... for ax in fig.get_axes():
... ax.label_outer()
...
... ###############################################################################
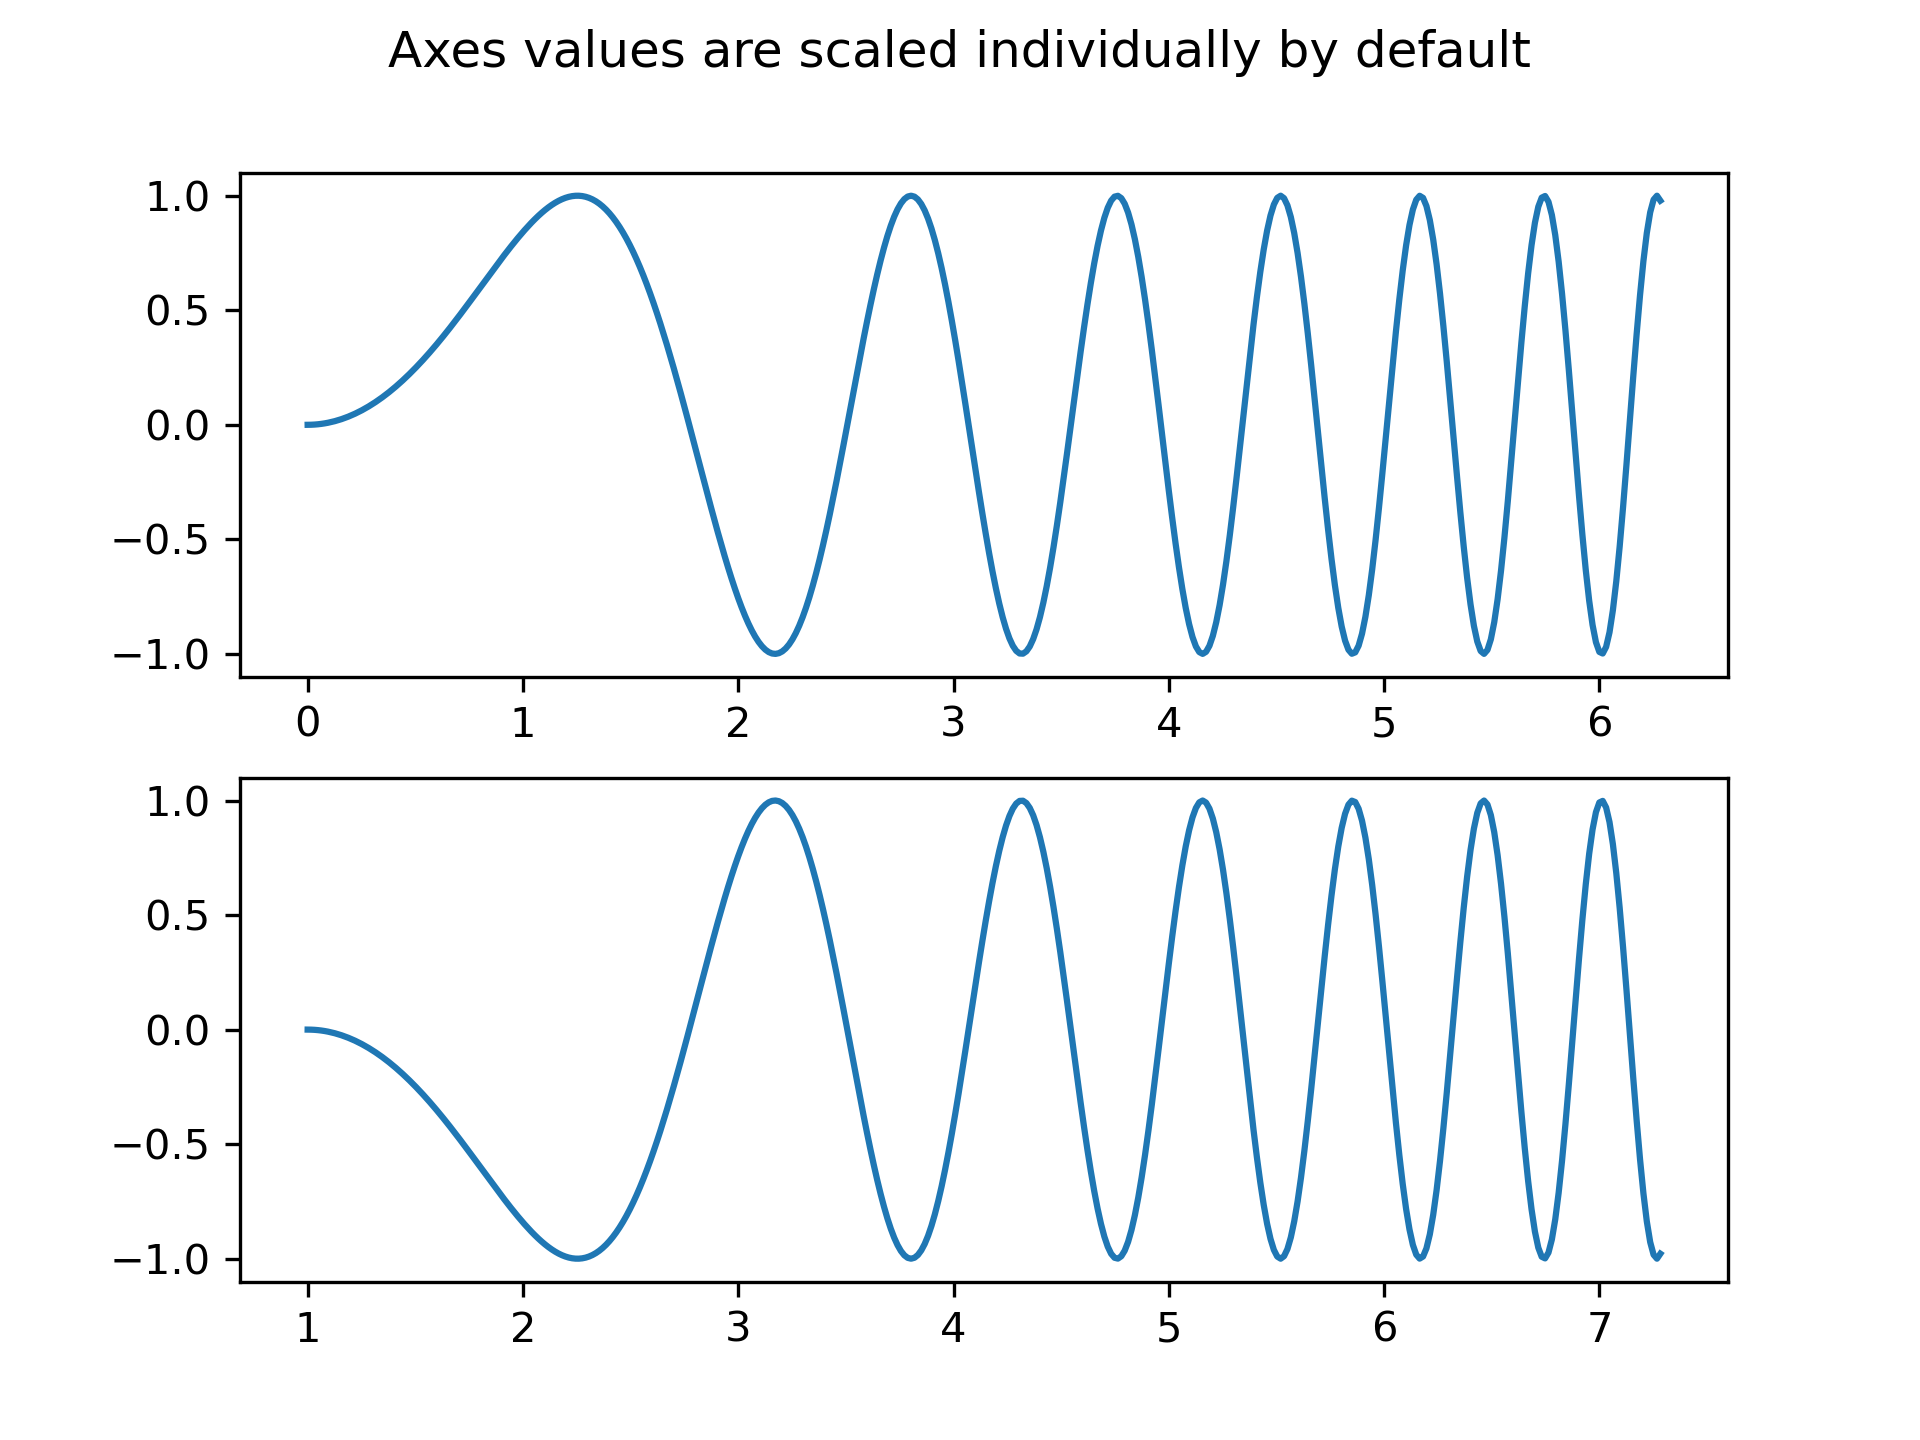
... # Sharing axes
... # """"""""""""
... #
... # By default, each Axes is scaled individually. Thus, if the ranges are
... # different the tick values of the subplots do not align.
...
... fig, (ax1, ax2) = plt.subplots(2)
... fig.suptitle('Axes values are scaled individually by default')
... ax1.plot(x, y)
... ax2.plot(x + 1, -y)
...
... ###############################################################################
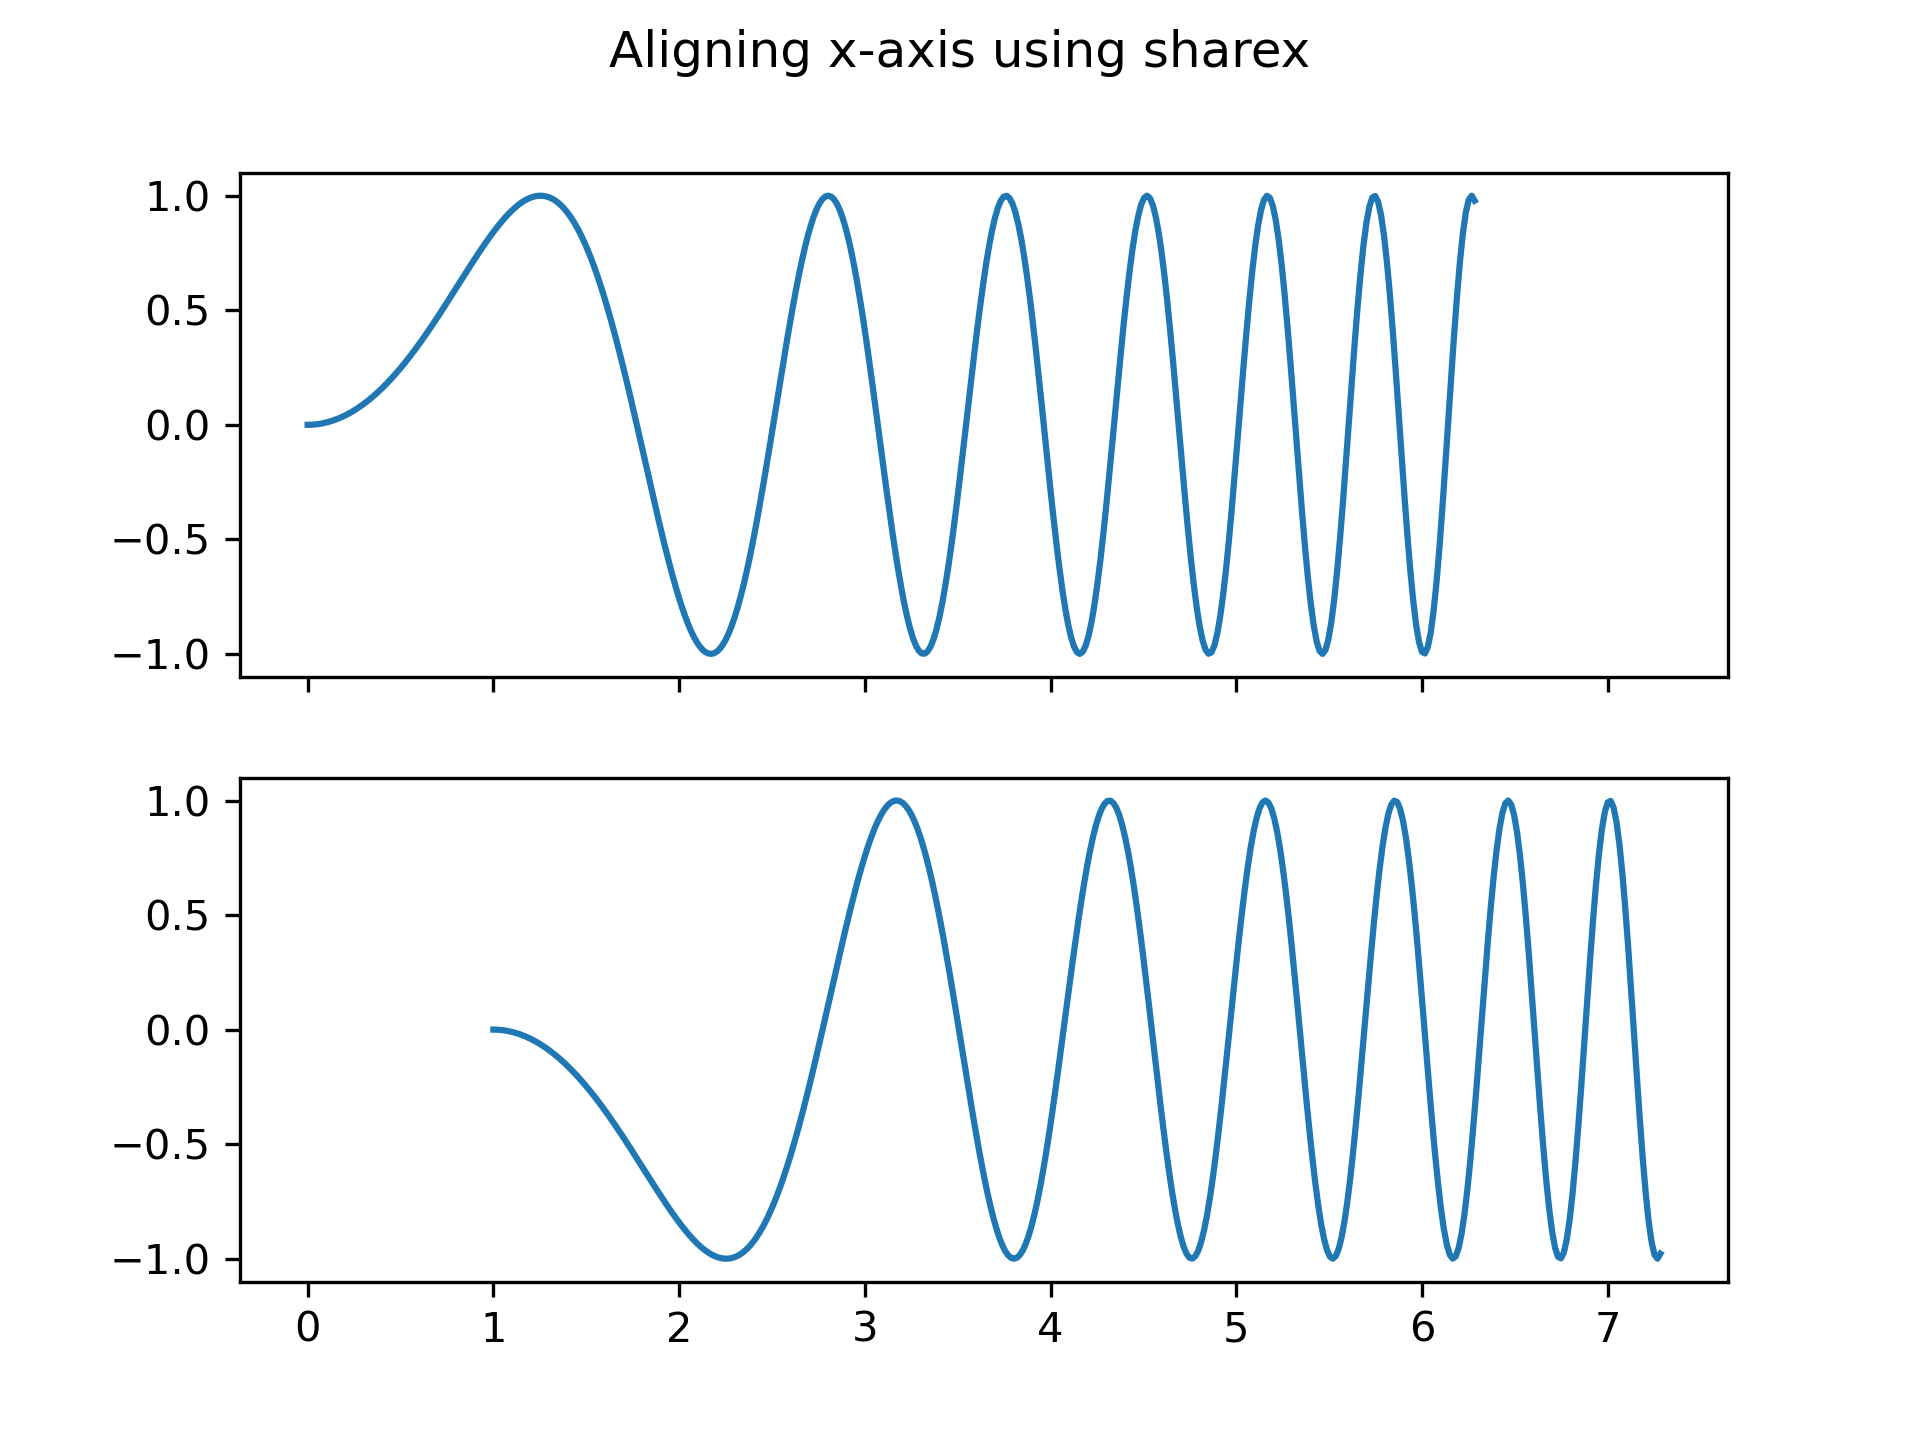
... # You can use *sharex* or *sharey* to align the horizontal or vertical axis.
...
... fig, (ax1, ax2) = plt.subplots(2, sharex=True)
... fig.suptitle('Aligning x-axis using sharex')
... ax1.plot(x, y)
... ax2.plot(x + 1, -y)
...
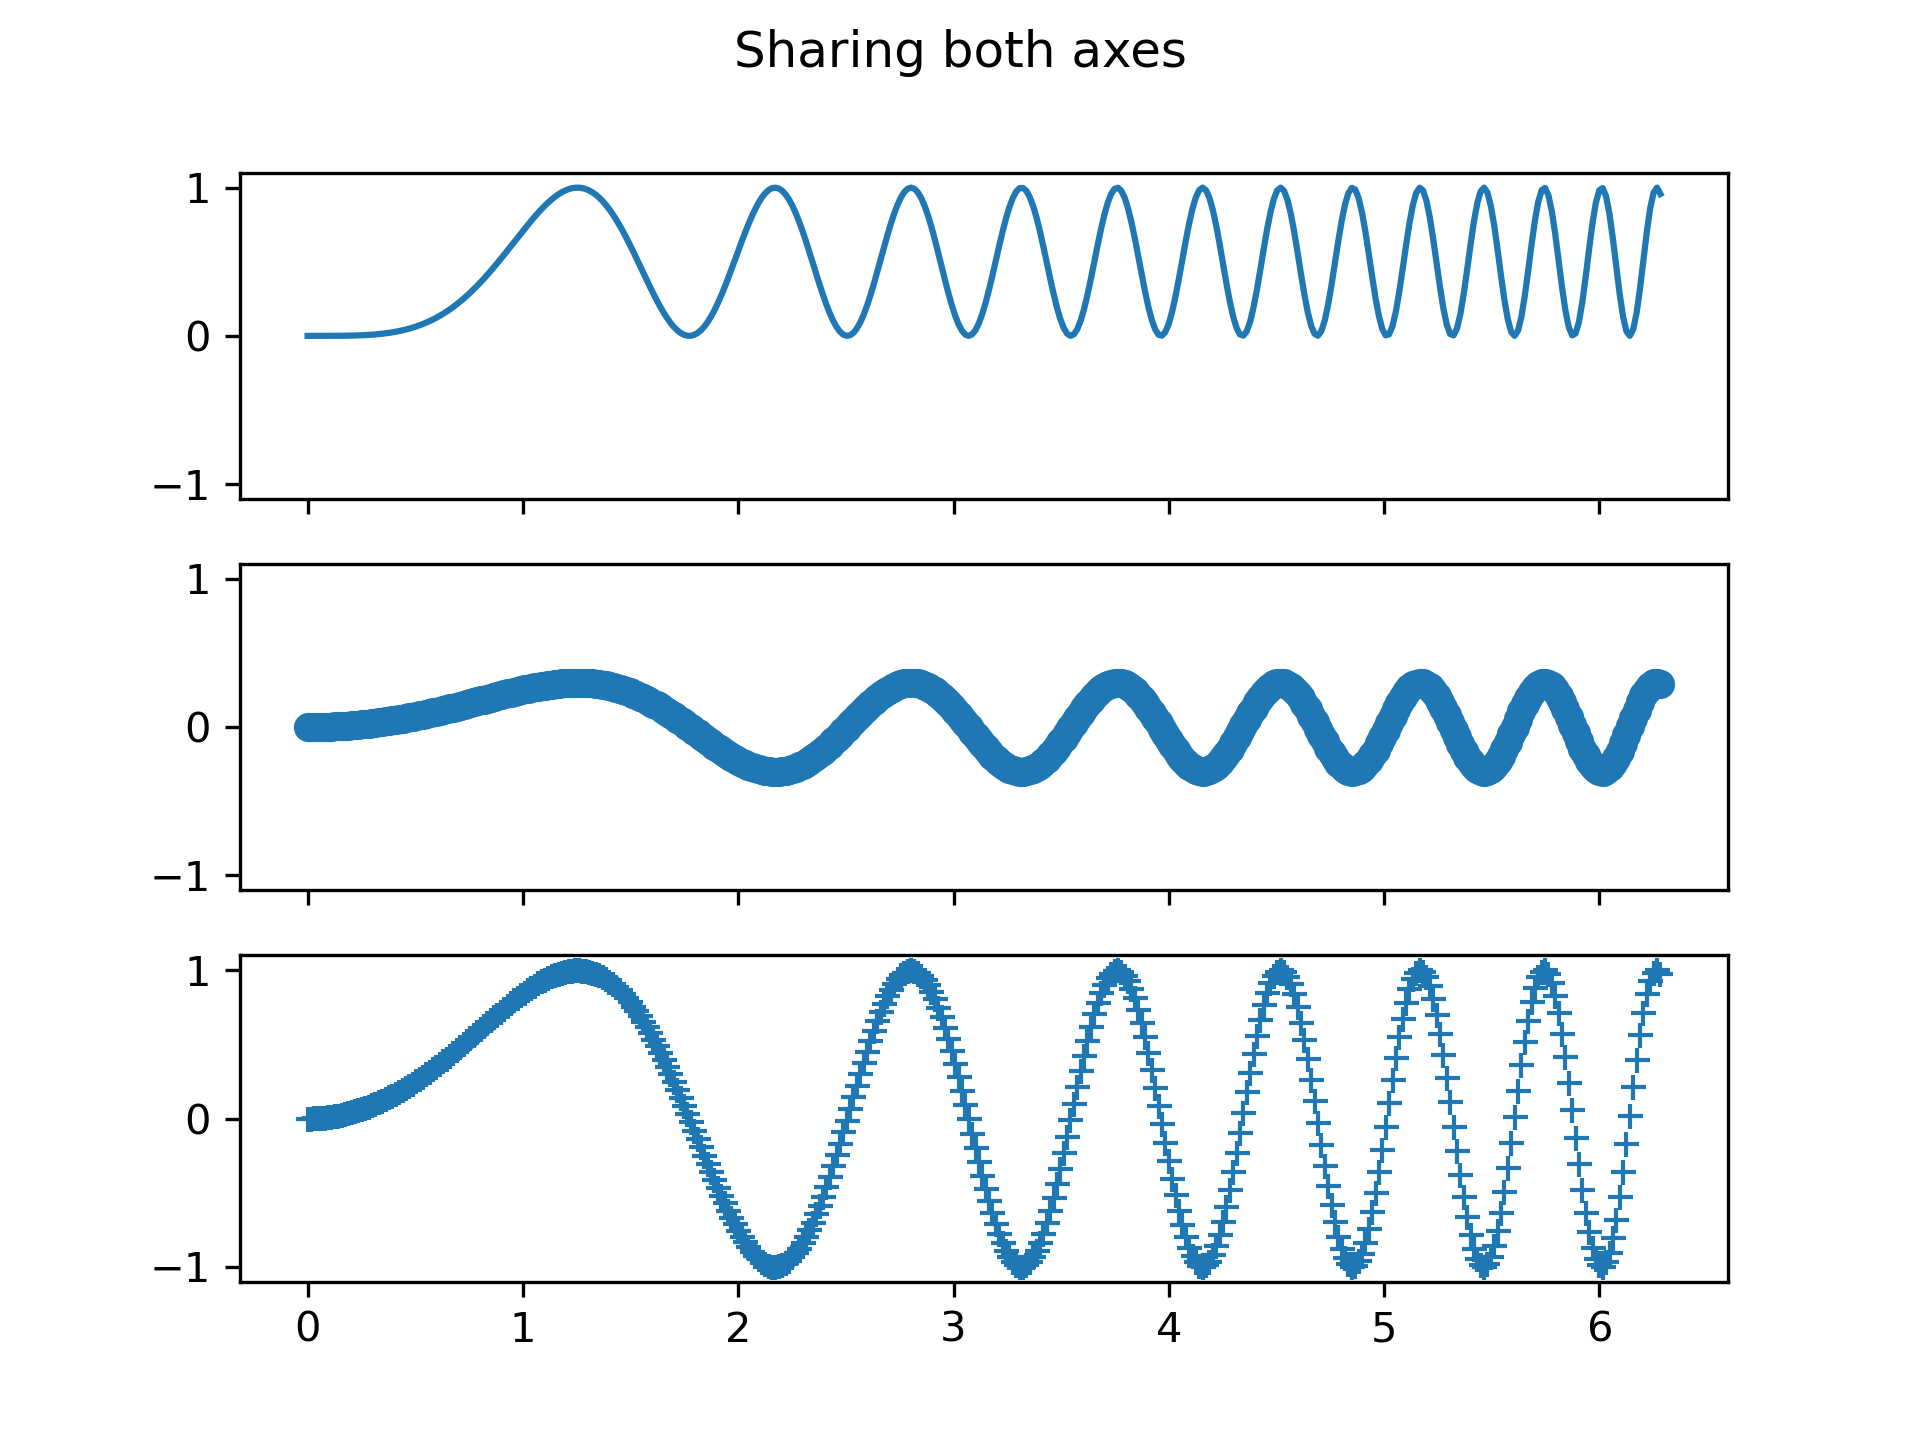
... ###############################################################################
... # Setting *sharex* or *sharey* to ``True`` enables global sharing across the
... # whole grid, i.e. also the y-axes of vertically stacked subplots have the
... # same scale when using ``sharey=True``.
...
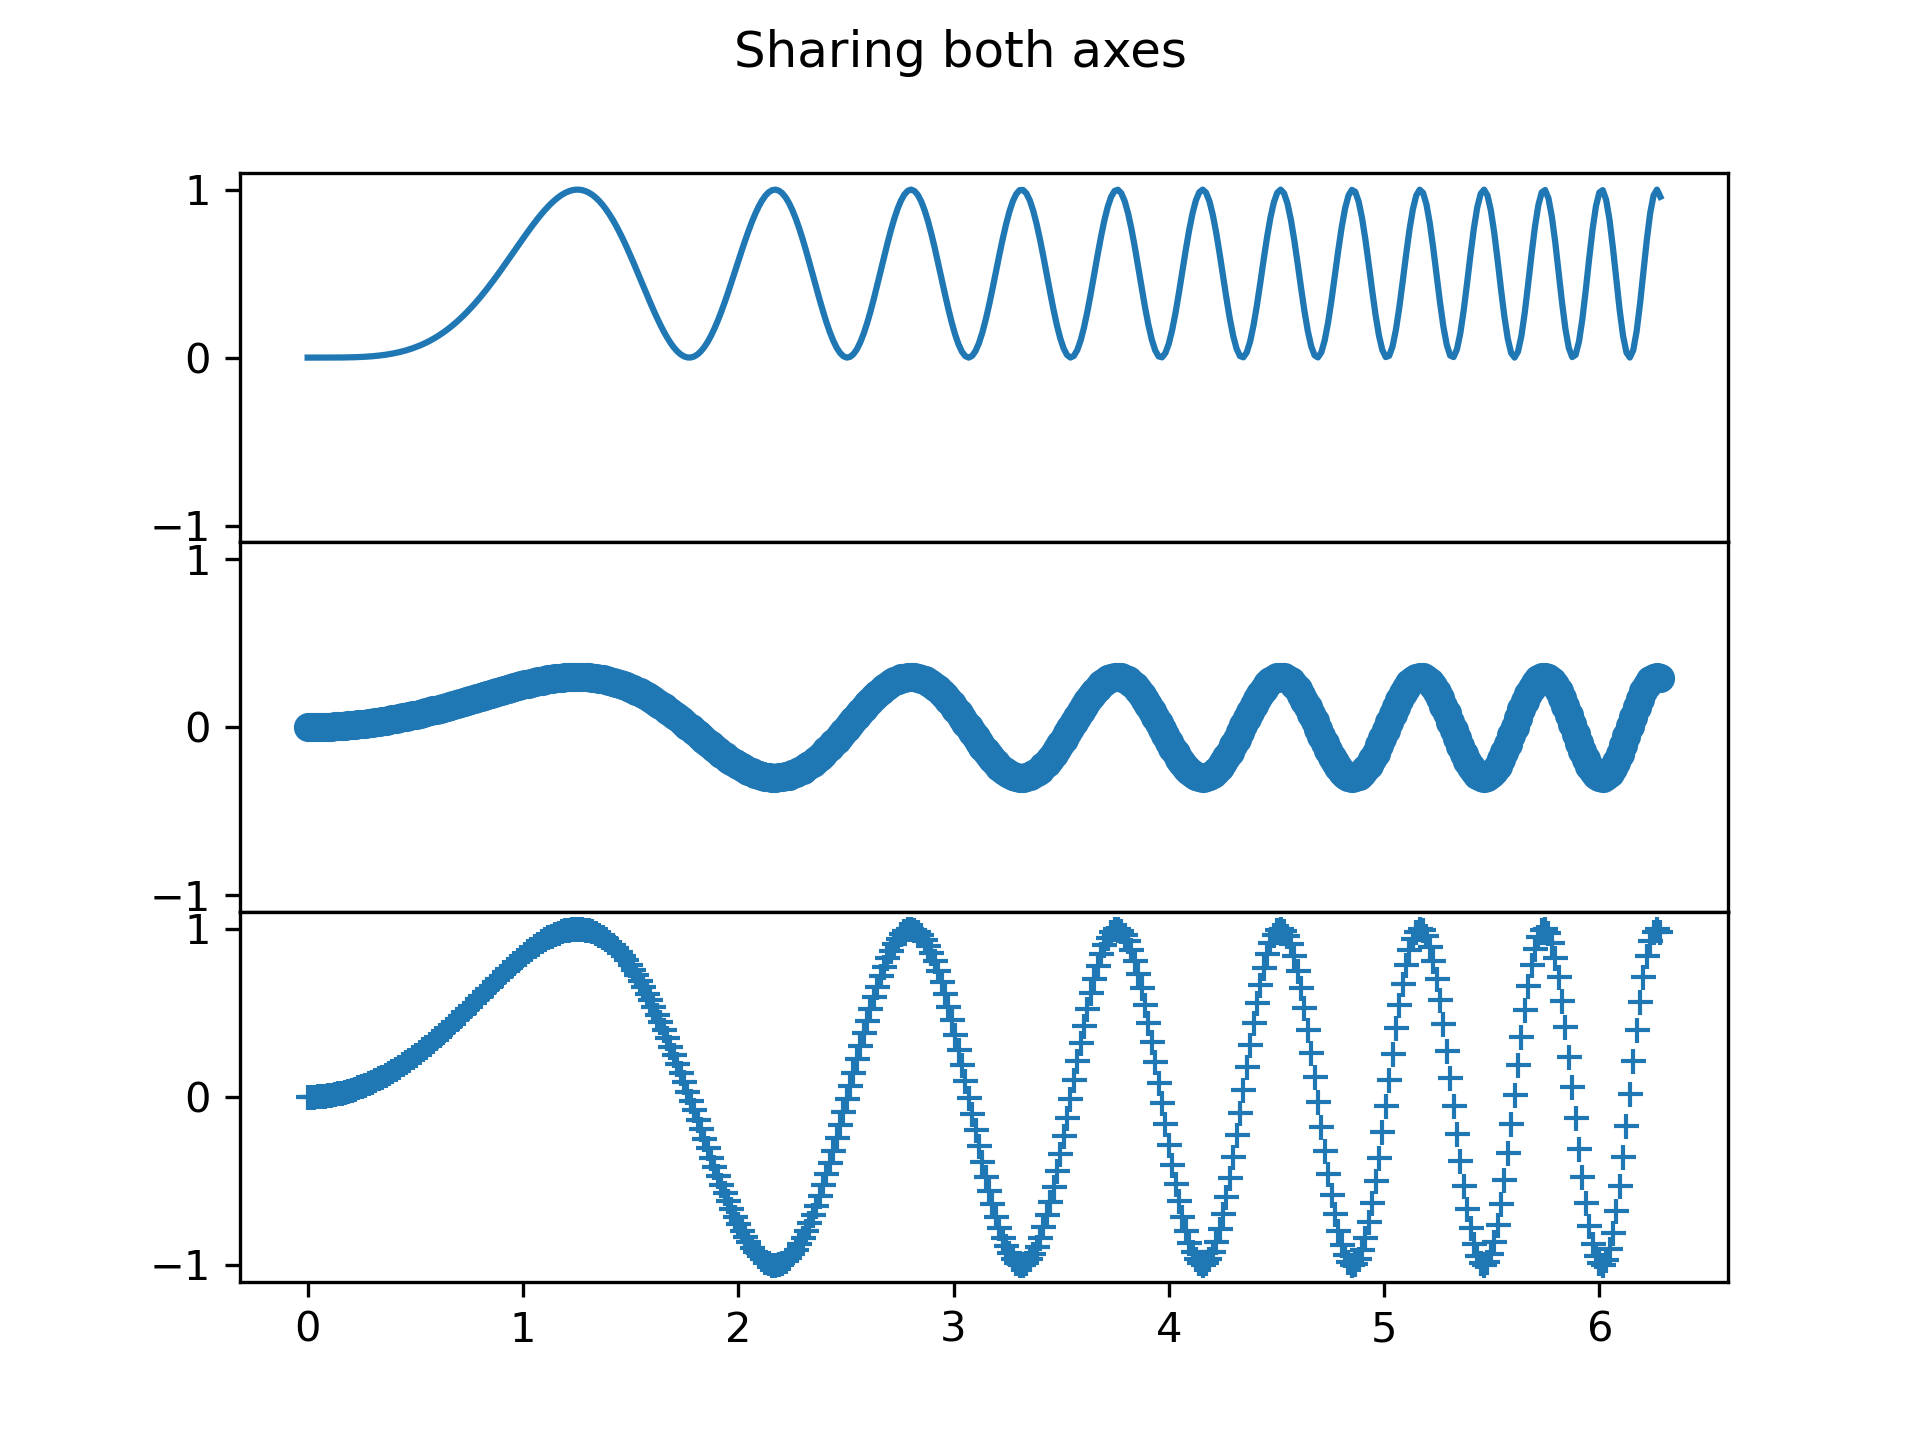
... fig, axs = plt.subplots(3, sharex=True, sharey=True)
... fig.suptitle('Sharing both axes')
... axs[0].plot(x, y ** 2)
... axs[1].plot(x, 0.3 * y, 'o')
... axs[2].plot(x, y, '+')
...
... ###############################################################################
... # For subplots that are sharing axes one set of tick labels is enough. Tick
... # labels of inner Axes are automatically removed by *sharex* and *sharey*.
... # Still there remains an unused empty space between the subplots.
... #
... # To precisely control the positioning of the subplots, one can explicitly
... # create a `.GridSpec` with `.Figure.add_gridspec`, and then call its
... # `~.GridSpecBase.subplots` method. For example, we can reduce the height
... # between vertical subplots using ``add_gridspec(hspace=0)``.
... #
... # `.label_outer` is a handy method to remove labels and ticks from subplots
... # that are not at the edge of the grid.
...
... fig = plt.figure()
... gs = fig.add_gridspec(3, hspace=0)
... axs = gs.subplots(sharex=True, sharey=True)
... fig.suptitle('Sharing both axes')
... axs[0].plot(x, y ** 2)
... axs[1].plot(x, 0.3 * y, 'o')
... axs[2].plot(x, y, '+')
...
... # Hide x labels and tick labels for all but bottom plot.
... for ax in axs:
... ax.label_outer()
...
... ###############################################################################
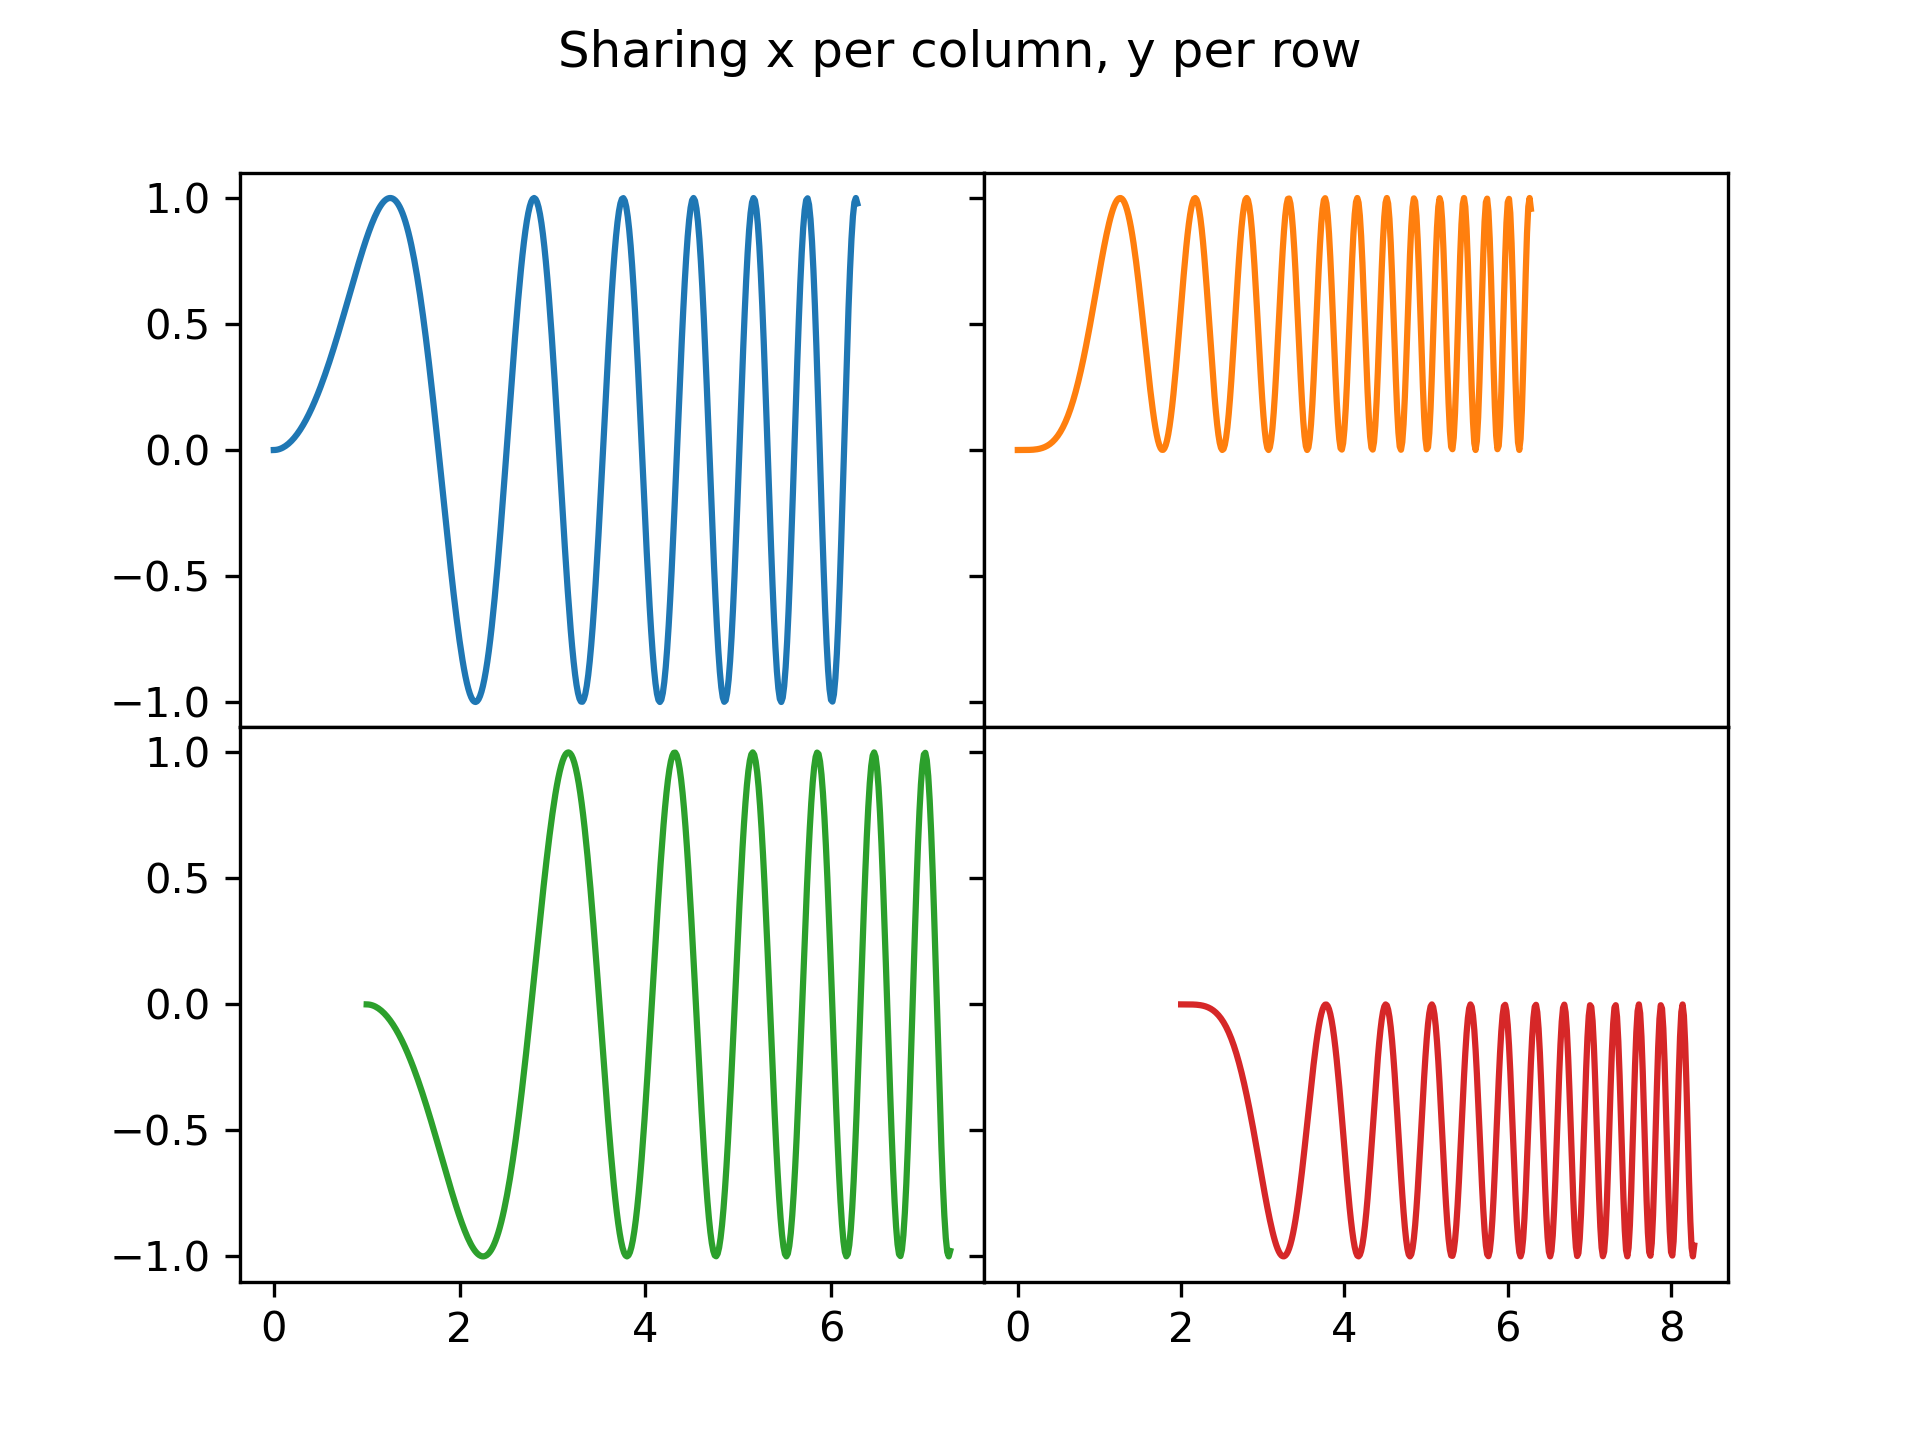
... # Apart from ``True`` and ``False``, both *sharex* and *sharey* accept the
... # values 'row' and 'col' to share the values only per row or column.
...
... fig = plt.figure()
... gs = fig.add_gridspec(2, 2, hspace=0, wspace=0)
... (ax1, ax2), (ax3, ax4) = gs.subplots(sharex='col', sharey='row')
... fig.suptitle('Sharing x per column, y per row')
... ax1.plot(x, y)
... ax2.plot(x, y**2, 'tab:orange')
... ax3.plot(x + 1, -y, 'tab:green')
... ax4.plot(x + 2, -y**2, 'tab:red')
...
... for ax in axs.flat:
... ax.label_outer()
...
... ###############################################################################
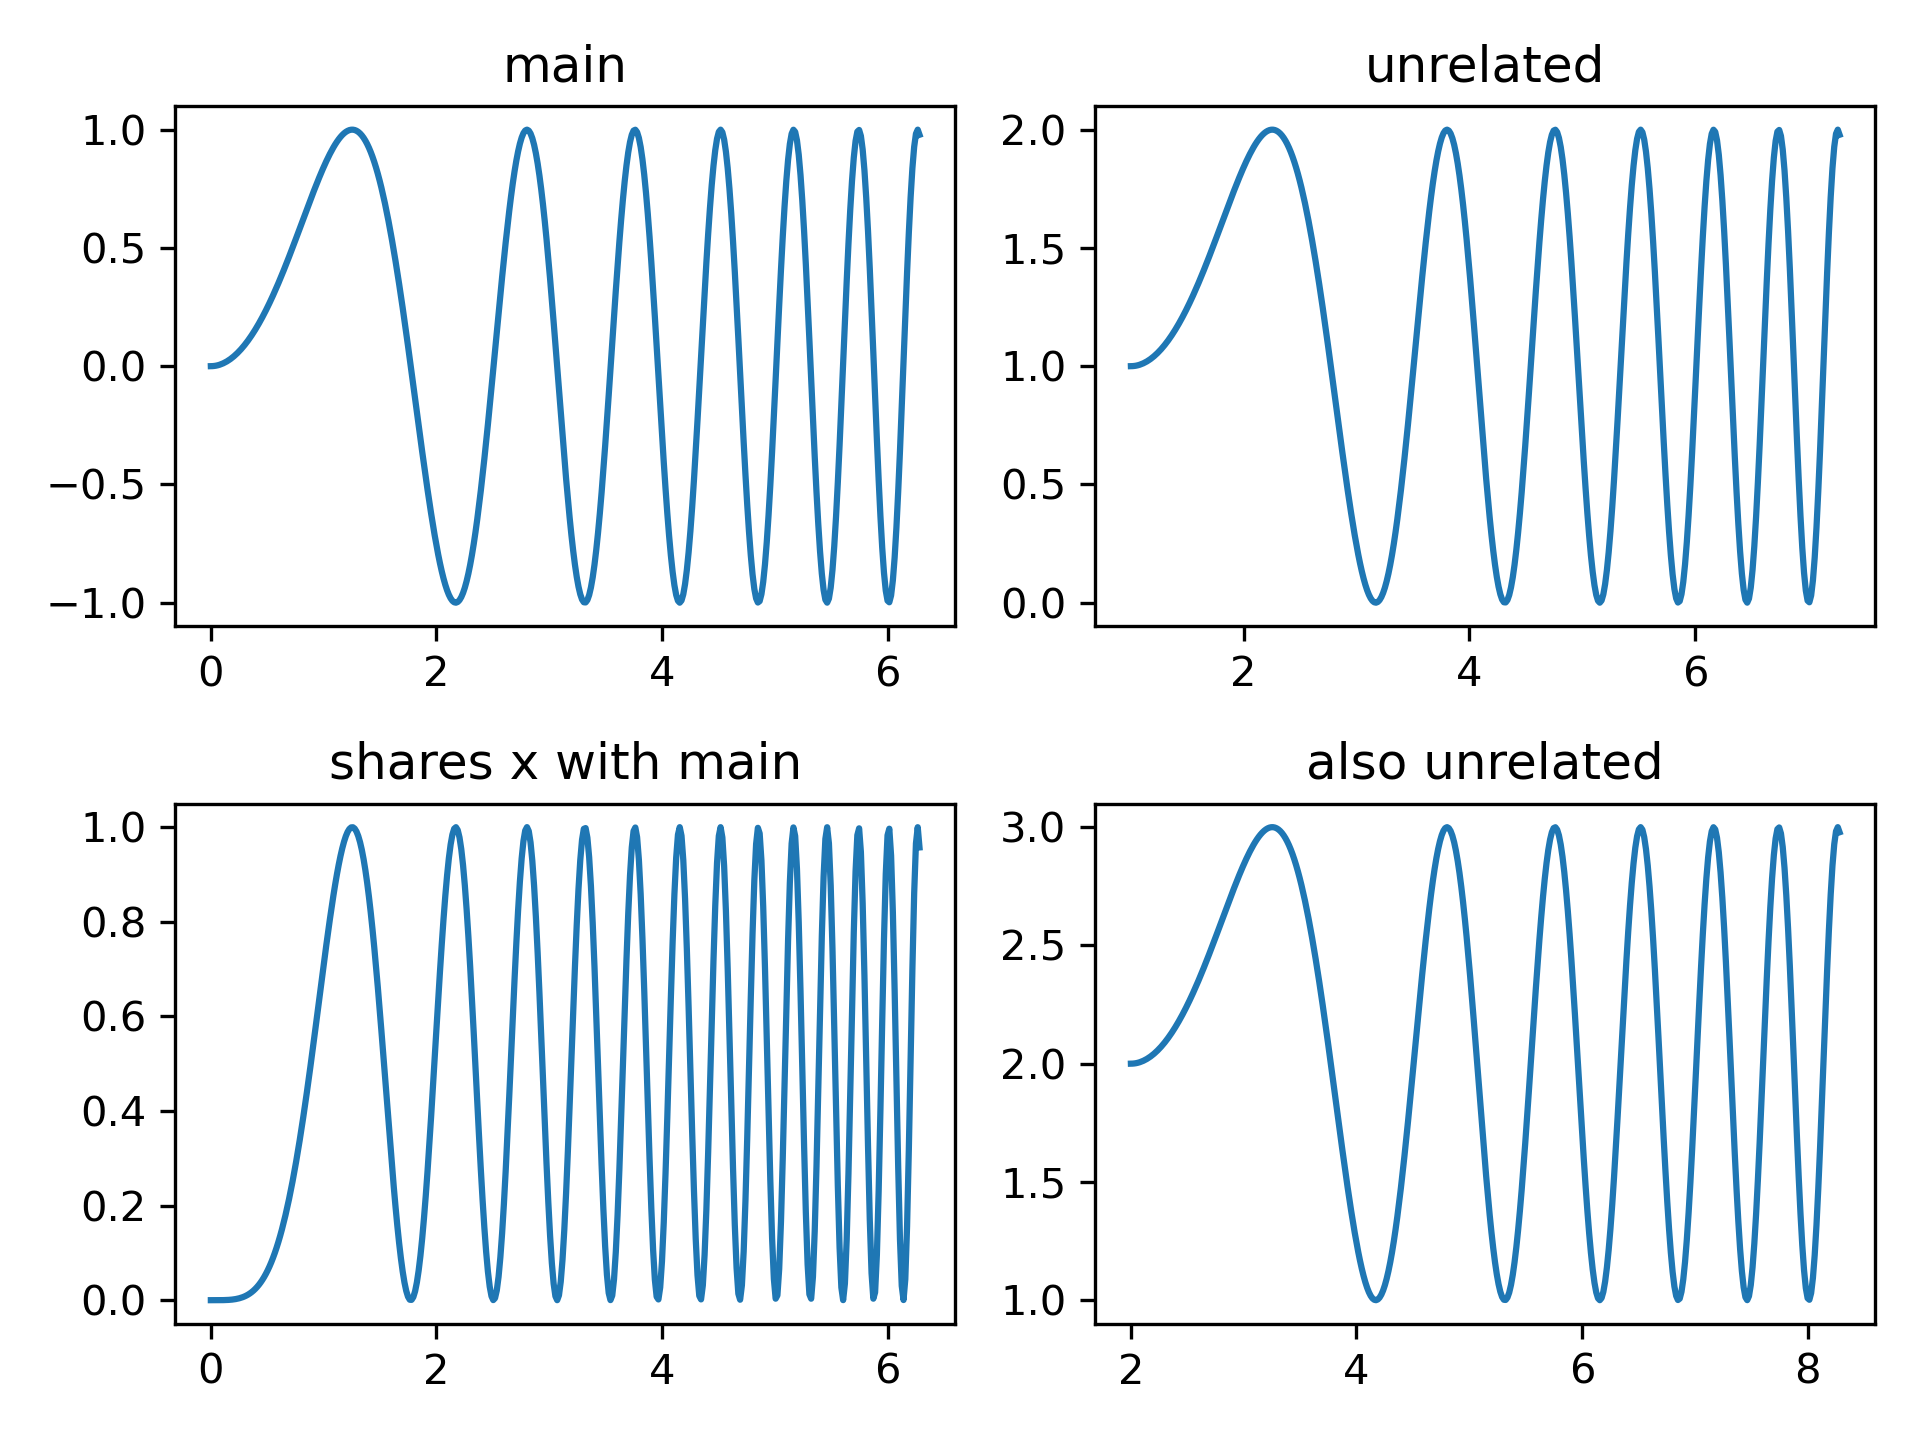
... # If you want a more complex sharing structure, you can first create the
... # grid of axes with no sharing, and then call `.axes.Axes.sharex` or
... # `.axes.Axes.sharey` to add sharing info a posteriori.
...
... fig, axs = plt.subplots(2, 2)
... axs[0, 0].plot(x, y)
... axs[0, 0].set_title("main")
... axs[1, 0].plot(x, y**2)
... axs[1, 0].set_title("shares x with main")
... axs[1, 0].sharex(axs[0, 0])
... axs[0, 1].plot(x + 1, y + 1)
... axs[0, 1].set_title("unrelated")
... axs[1, 1].plot(x + 2, y + 2)
... axs[1, 1].set_title("also unrelated")
... fig.tight_layout()
...
... ###############################################################################
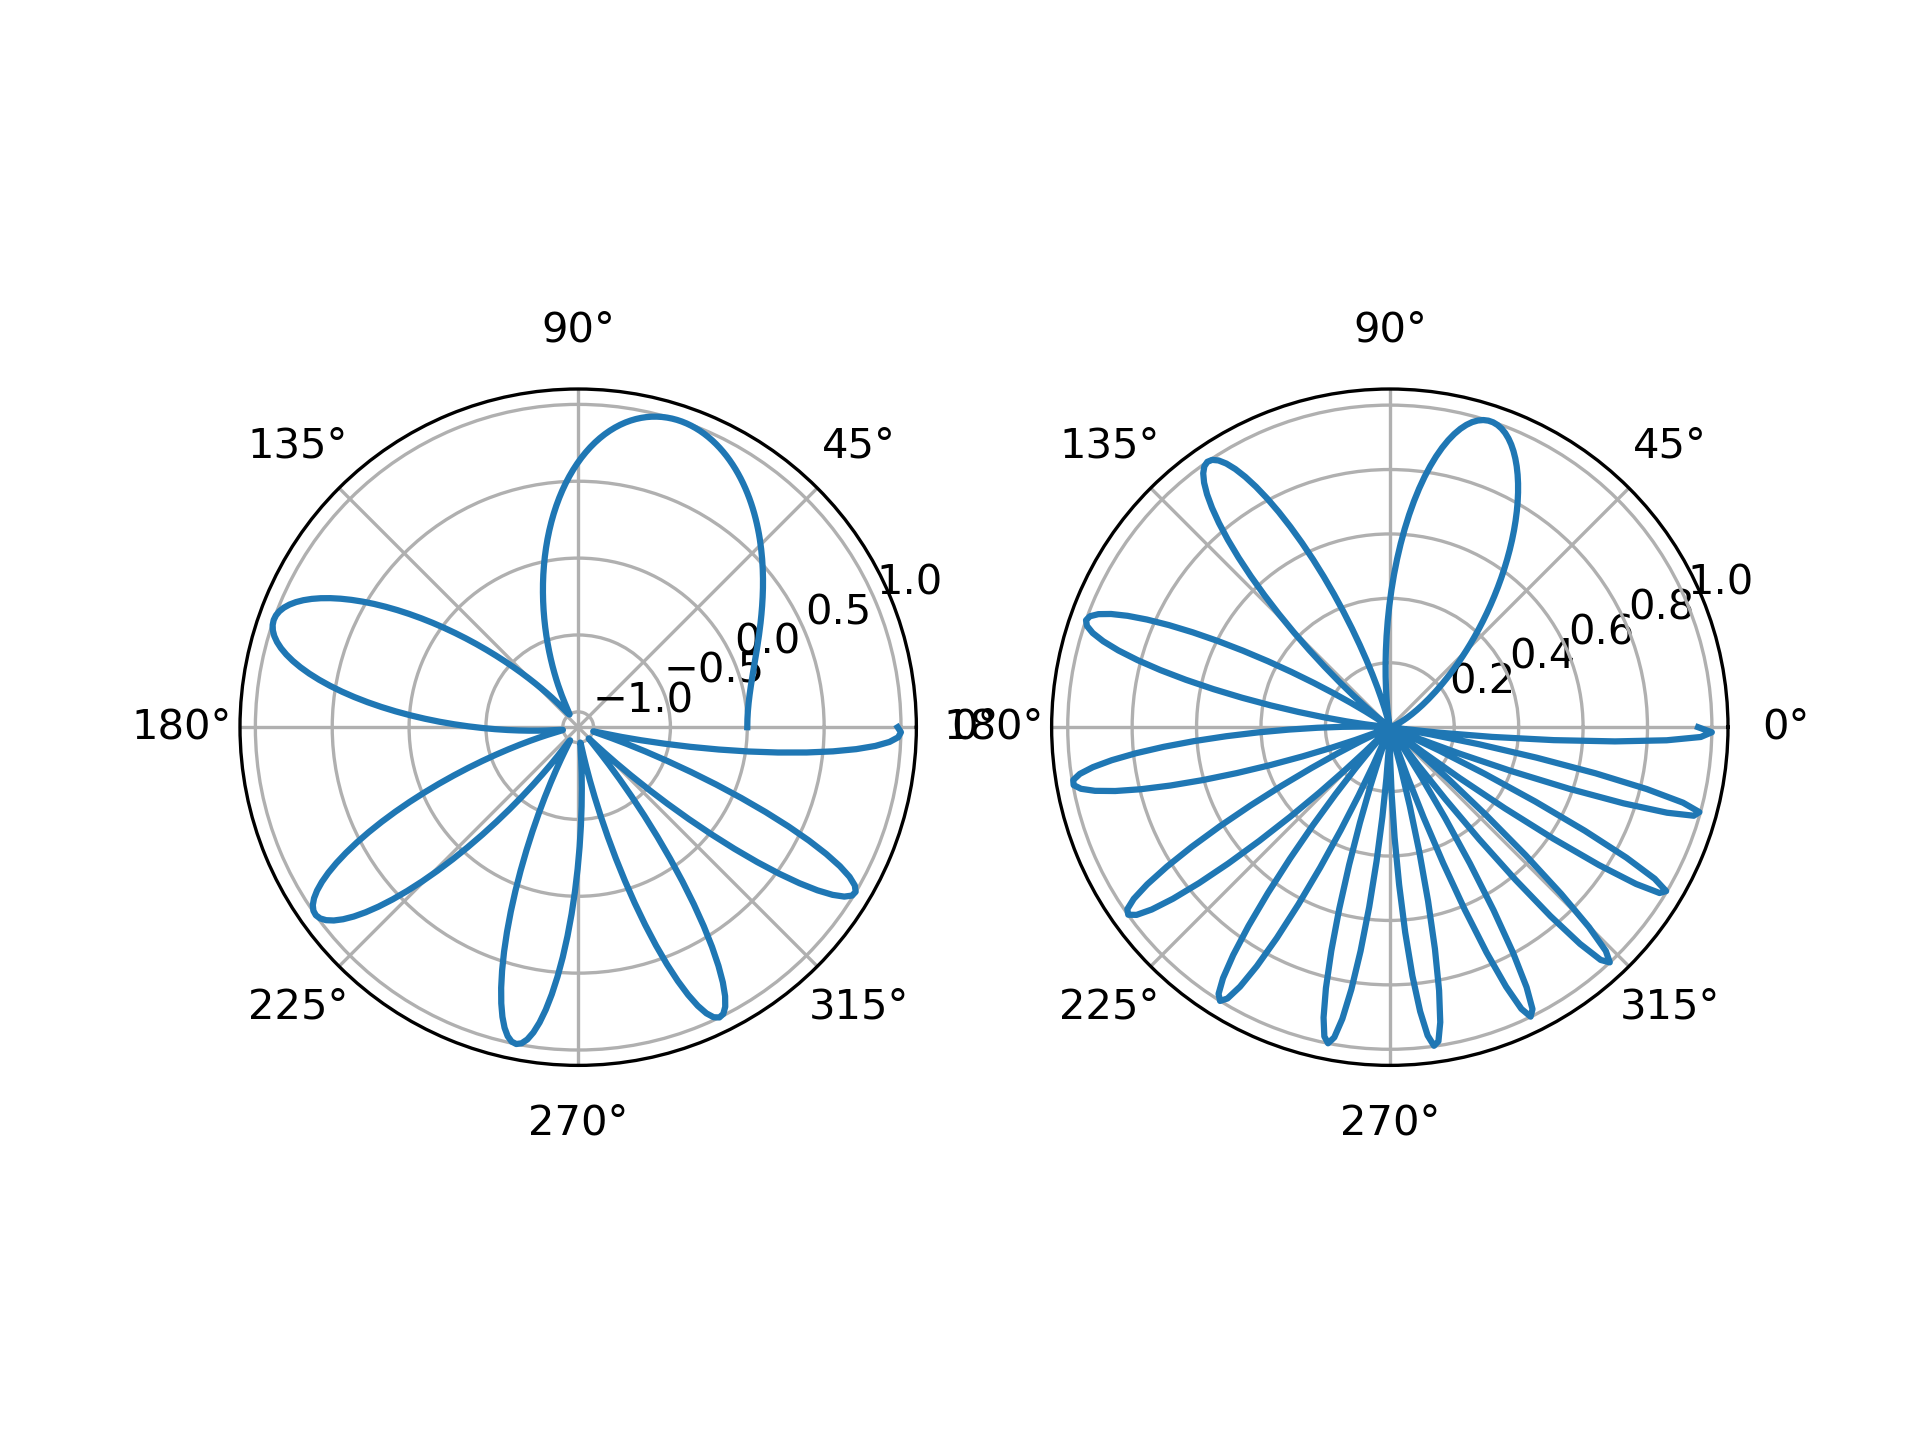
... # Polar axes
... # """"""""""
... #
... # The parameter *subplot_kw* of `.pyplot.subplots` controls the subplot
... # properties (see also `.Figure.add_subplot`). In particular, this can be used
... # to create a grid of polar Axes.
...
... fig, (ax1, ax2) = plt.subplots(1, 2, subplot_kw=dict(projection='polar'))
... ax1.plot(x, y)
... ax2.plot(x, y ** 2)
...
... plt.show()
...