>>> """
=================
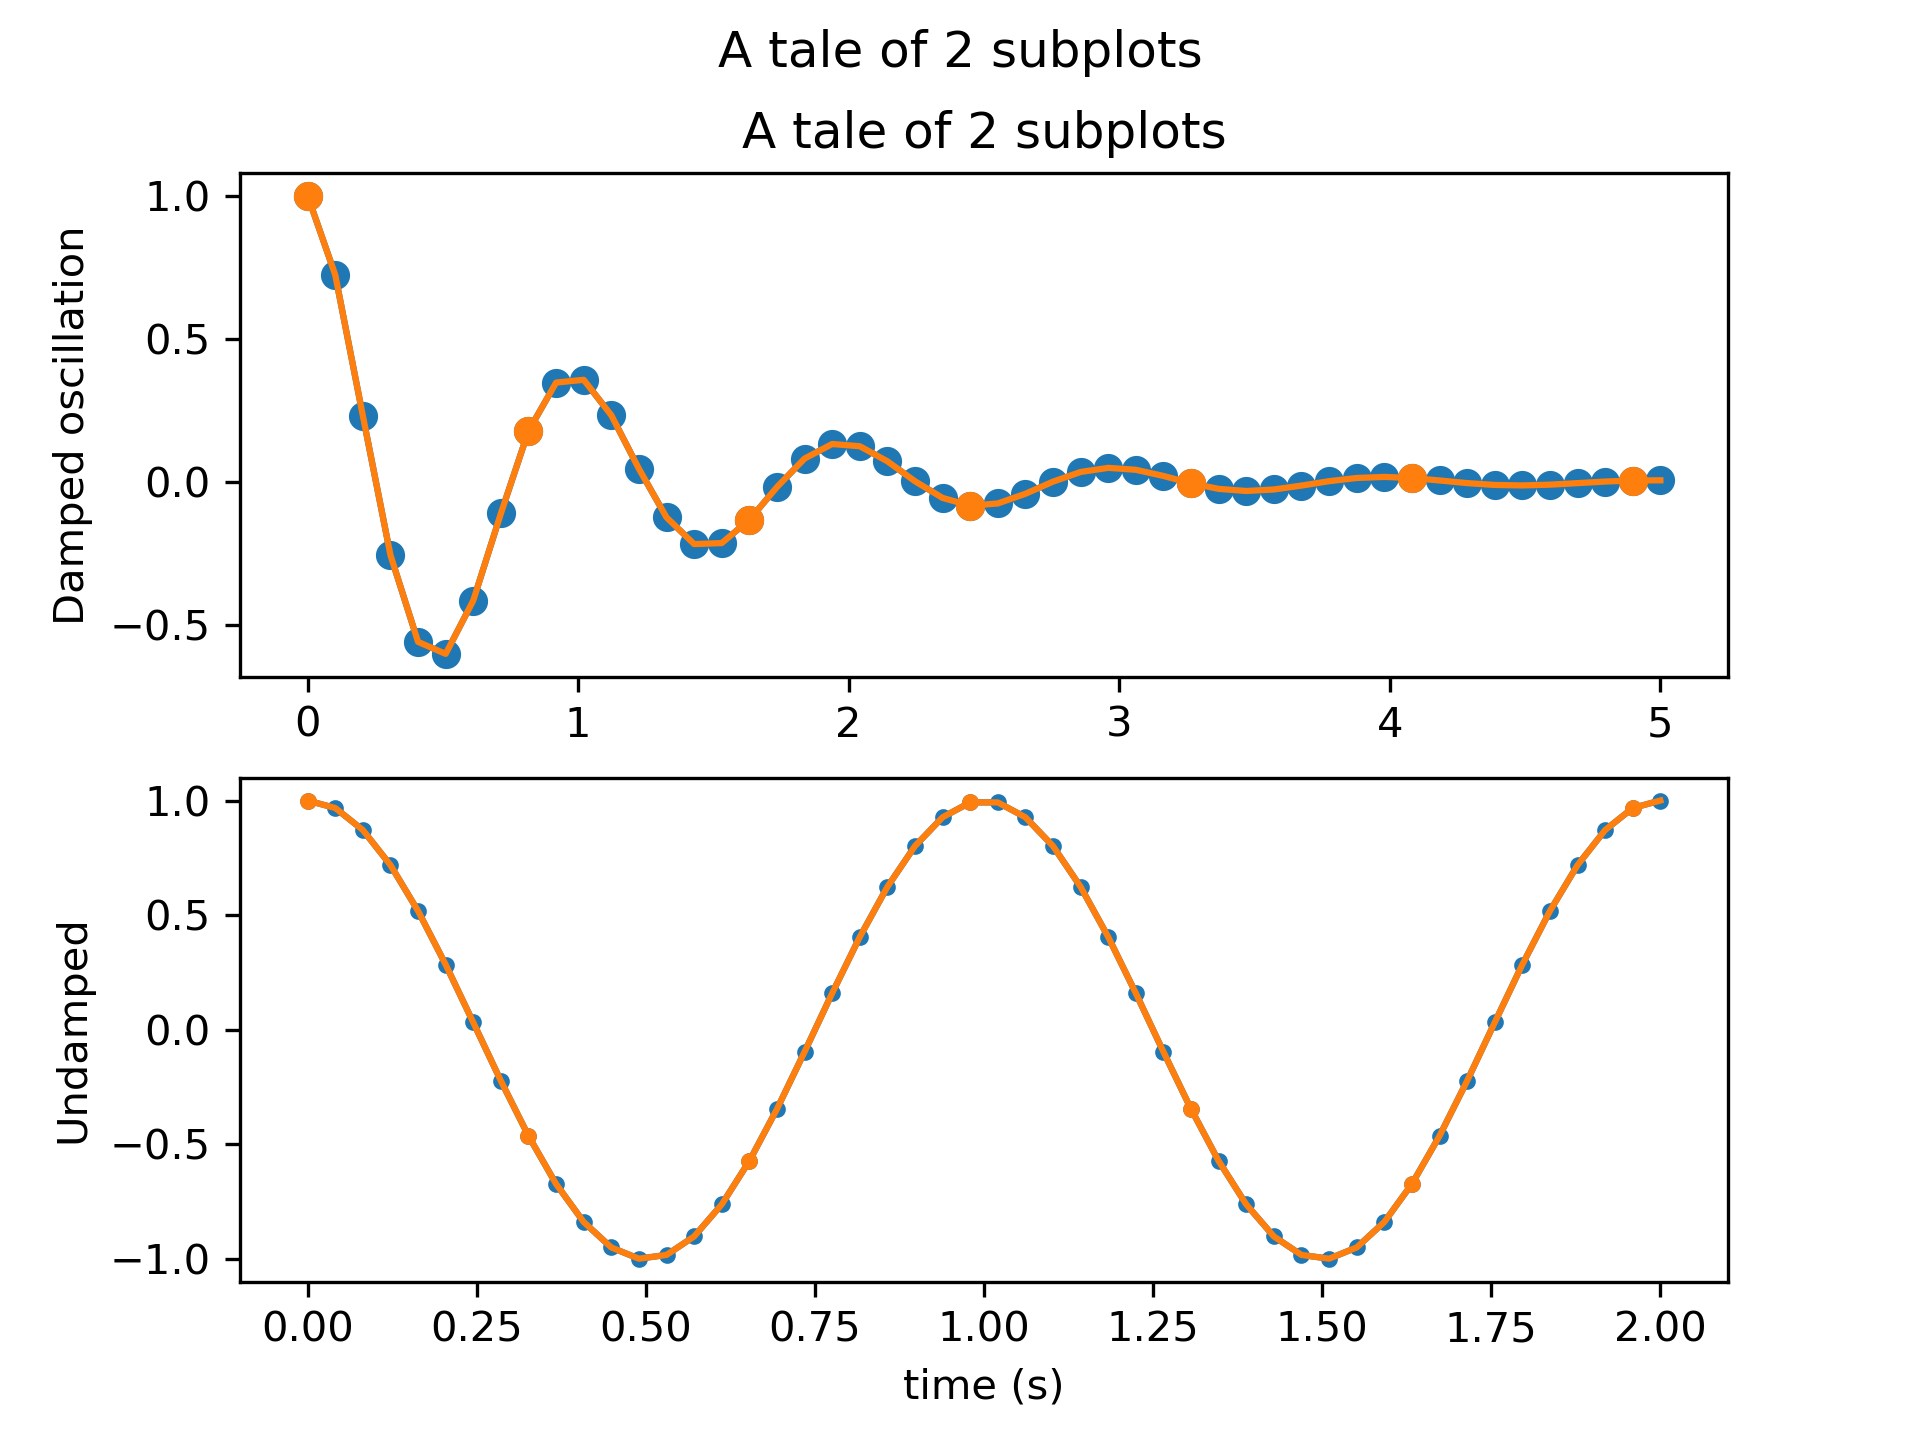
Multiple subplots
=================
Simple demo with multiple subplots.
For more options, see :doc:`/gallery/subplots_axes_and_figures/subplots_demo`.
.. redirect-from:: /gallery/subplots_axes_and_figures/subplot_demo
"""
...
... import numpy as np
... import matplotlib.pyplot as plt
...
... # Create some fake data.
... x1 = np.linspace(0.0, 5.0)
... y1 = np.cos(2 * np.pi * x1) * np.exp(-x1)
... x2 = np.linspace(0.0, 2.0)
... y2 = np.cos(2 * np.pi * x2)
...
... ###############################################################################
... # `~.pyplot.subplots()` is the recommended method to generate simple subplot
... # arrangements:
...
... fig, (ax1, ax2) = plt.subplots(2, 1)
... fig.suptitle('A tale of 2 subplots')
...
... ax1.plot(x1, y1, 'o-')
... ax1.set_ylabel('Damped oscillation')
...
... ax2.plot(x2, y2, '.-')
... ax2.set_xlabel('time (s)')
... ax2.set_ylabel('Undamped')
...
... plt.show()
...
... ###############################################################################
... # Subplots can also be generated one at a time using `~.pyplot.subplot()`:
...
... plt.subplot(2, 1, 1)
... plt.plot(x1, y1, 'o-')
... plt.title('A tale of 2 subplots')
... plt.ylabel('Damped oscillation')
...
... plt.subplot(2, 1, 2)
... plt.plot(x2, y2, '.-')
... plt.xlabel('time (s)')
... plt.ylabel('Undamped')
...
... plt.show()
...