>>> """
=================
Figure subfigures
=================
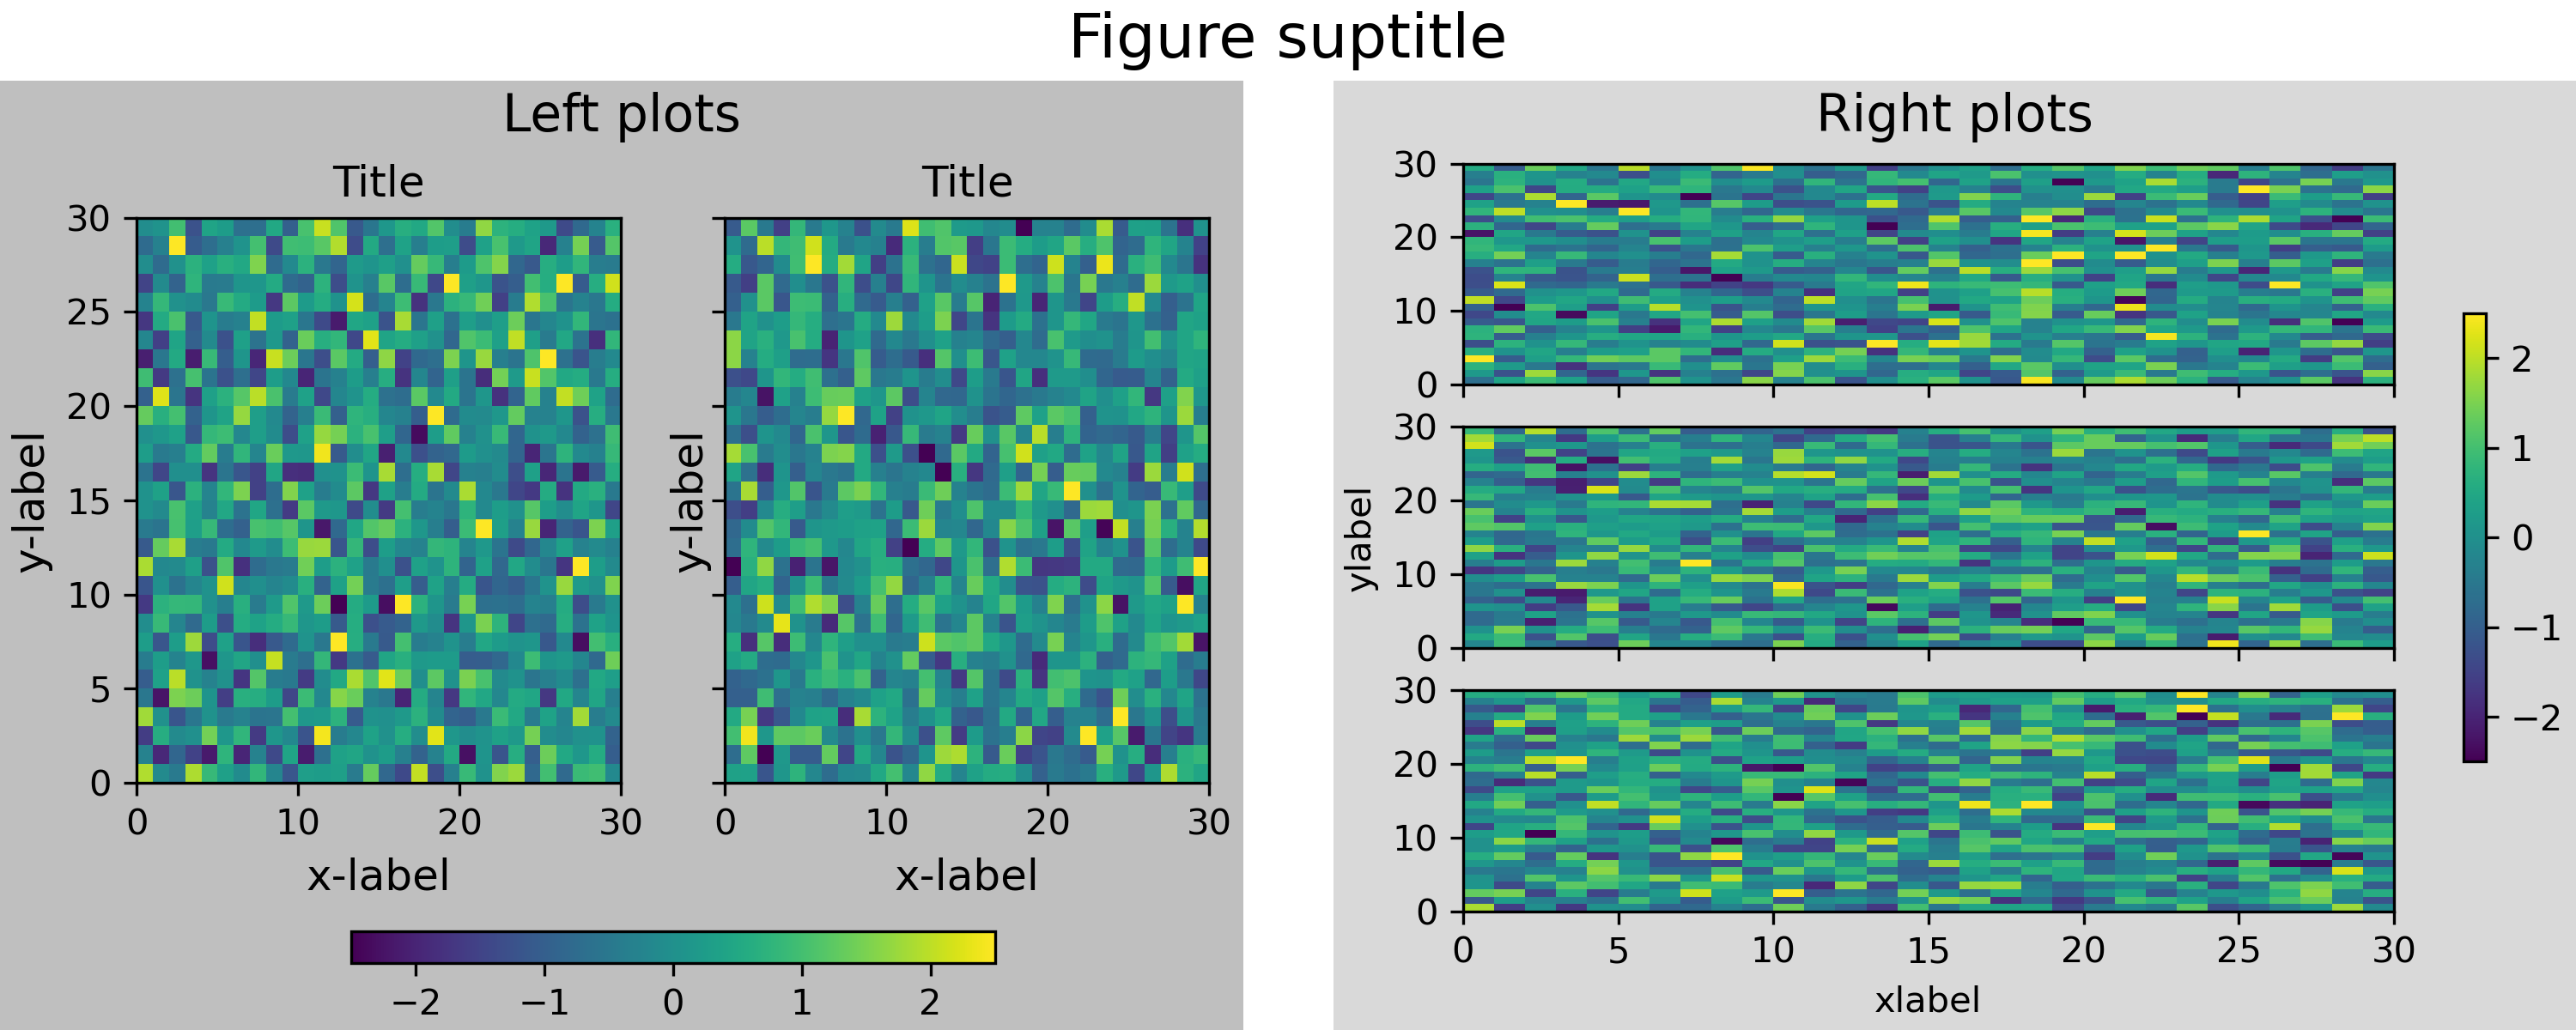
Sometimes it is desirable to have a figure with two different layouts in it.
This can be achieved with
:doc:`nested gridspecs</gallery/subplots_axes_and_figures/gridspec_nested>`,
but having a virtual figure with its own artists is helpful, so
Matplotlib also has "subfigures", accessed by calling
`matplotlib.figure.Figure.add_subfigure` in a way that is analogous to
`matplotlib.figure.Figure.add_subplot`, or
`matplotlib.figure.Figure.subfigures` to make an array of subfigures. Note
that subfigures can also have their own child subfigures.
.. note::
``subfigure`` is new in v3.4, and the API is still provisional.
"""
... import matplotlib.pyplot as plt
... import numpy as np
...
...
... def example_plot(ax, fontsize=12, hide_labels=False):
... pc = ax.pcolormesh(np.random.randn(30, 30), vmin=-2.5, vmax=2.5)
... if not hide_labels:
... ax.set_xlabel('x-label', fontsize=fontsize)
... ax.set_ylabel('y-label', fontsize=fontsize)
... ax.set_title('Title', fontsize=fontsize)
... return pc
...
... np.random.seed(19680808)
... # gridspec inside gridspec
... fig = plt.figure(constrained_layout=True, figsize=(10, 4))
... subfigs = fig.subfigures(1, 2, wspace=0.07)
...
... axsLeft = subfigs[0].subplots(1, 2, sharey=True)
... subfigs[0].set_facecolor('0.75')
... for ax in axsLeft:
... pc = example_plot(ax)
... subfigs[0].suptitle('Left plots', fontsize='x-large')
... subfigs[0].colorbar(pc, shrink=0.6, ax=axsLeft, location='bottom')
...
... axsRight = subfigs[1].subplots(3, 1, sharex=True)
... for nn, ax in enumerate(axsRight):
... pc = example_plot(ax, hide_labels=True)
... if nn == 2:
... ax.set_xlabel('xlabel')
... if nn == 1:
... ax.set_ylabel('ylabel')
...
... subfigs[1].set_facecolor('0.85')
... subfigs[1].colorbar(pc, shrink=0.6, ax=axsRight)
... subfigs[1].suptitle('Right plots', fontsize='x-large')
...
... fig.suptitle('Figure suptitle', fontsize='xx-large')
...
... plt.show()
...
... ##############################################################################
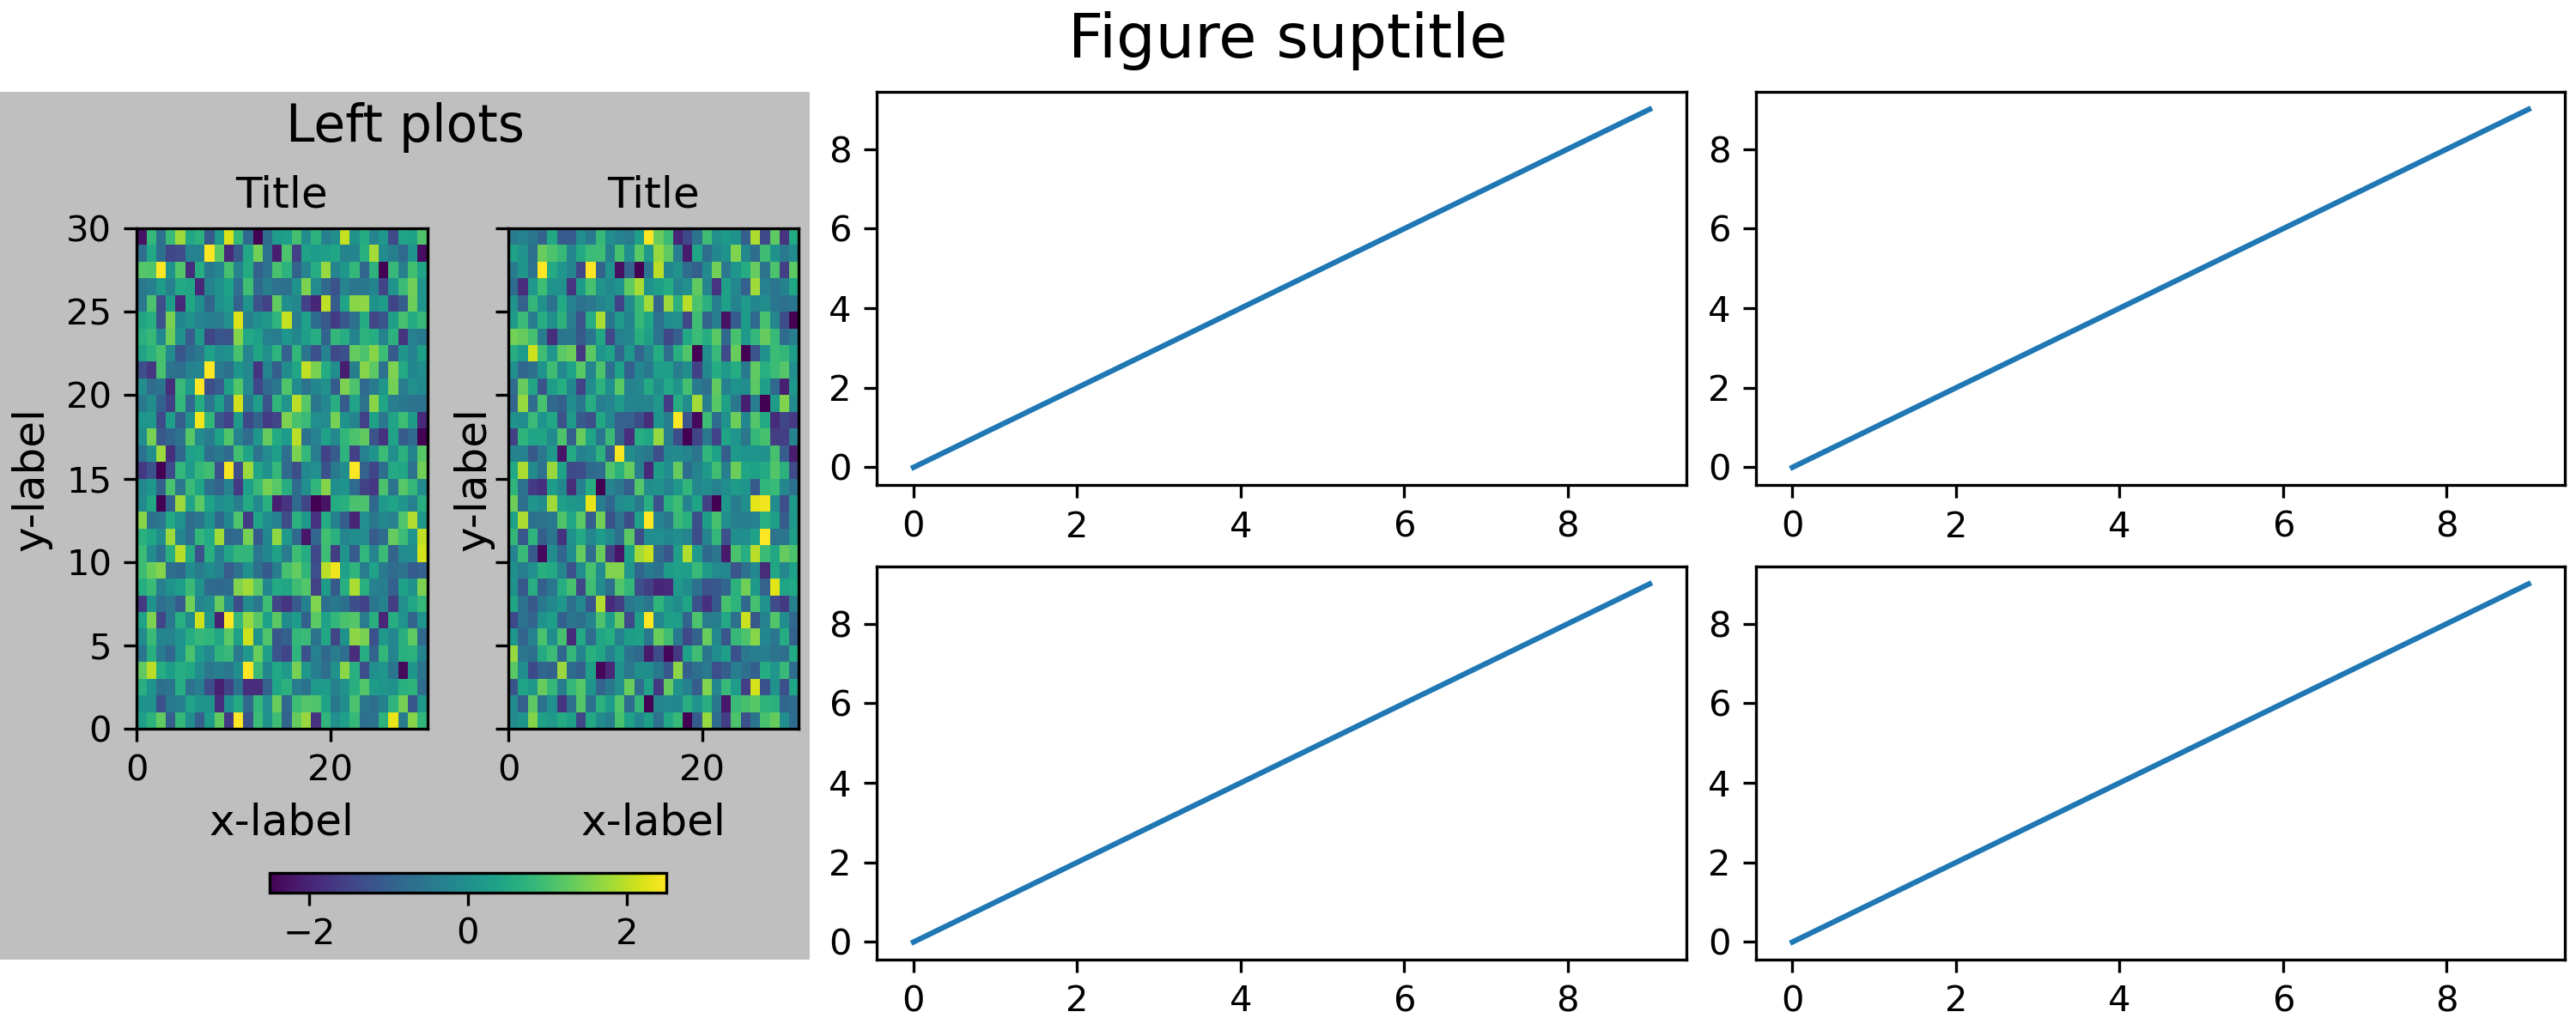
... # It is possible to mix subplots and subfigures using
... # `matplotlib.figure.Figure.add_subfigure`. This requires getting
... # the gridspec that the subplots are laid out on.
...
... fig, axs = plt.subplots(2, 3, constrained_layout=True, figsize=(10, 4))
... gridspec = axs[0, 0].get_subplotspec().get_gridspec()
...
... # clear the left column for the subfigure:
... for a in axs[:, 0]:
... a.remove()
...
... # plot data in remaining axes:
... for a in axs[:, 1:].flat:
... a.plot(np.arange(10))
...
... # make the subfigure in the empty gridspec slots:
... subfig = fig.add_subfigure(gridspec[:, 0])
...
... axsLeft = subfig.subplots(1, 2, sharey=True)
... subfig.set_facecolor('0.75')
... for ax in axsLeft:
... pc = example_plot(ax)
... subfig.suptitle('Left plots', fontsize='x-large')
... subfig.colorbar(pc, shrink=0.6, ax=axsLeft, location='bottom')
...
... fig.suptitle('Figure suptitle', fontsize='xx-large')
... plt.show()
...
... ##############################################################################
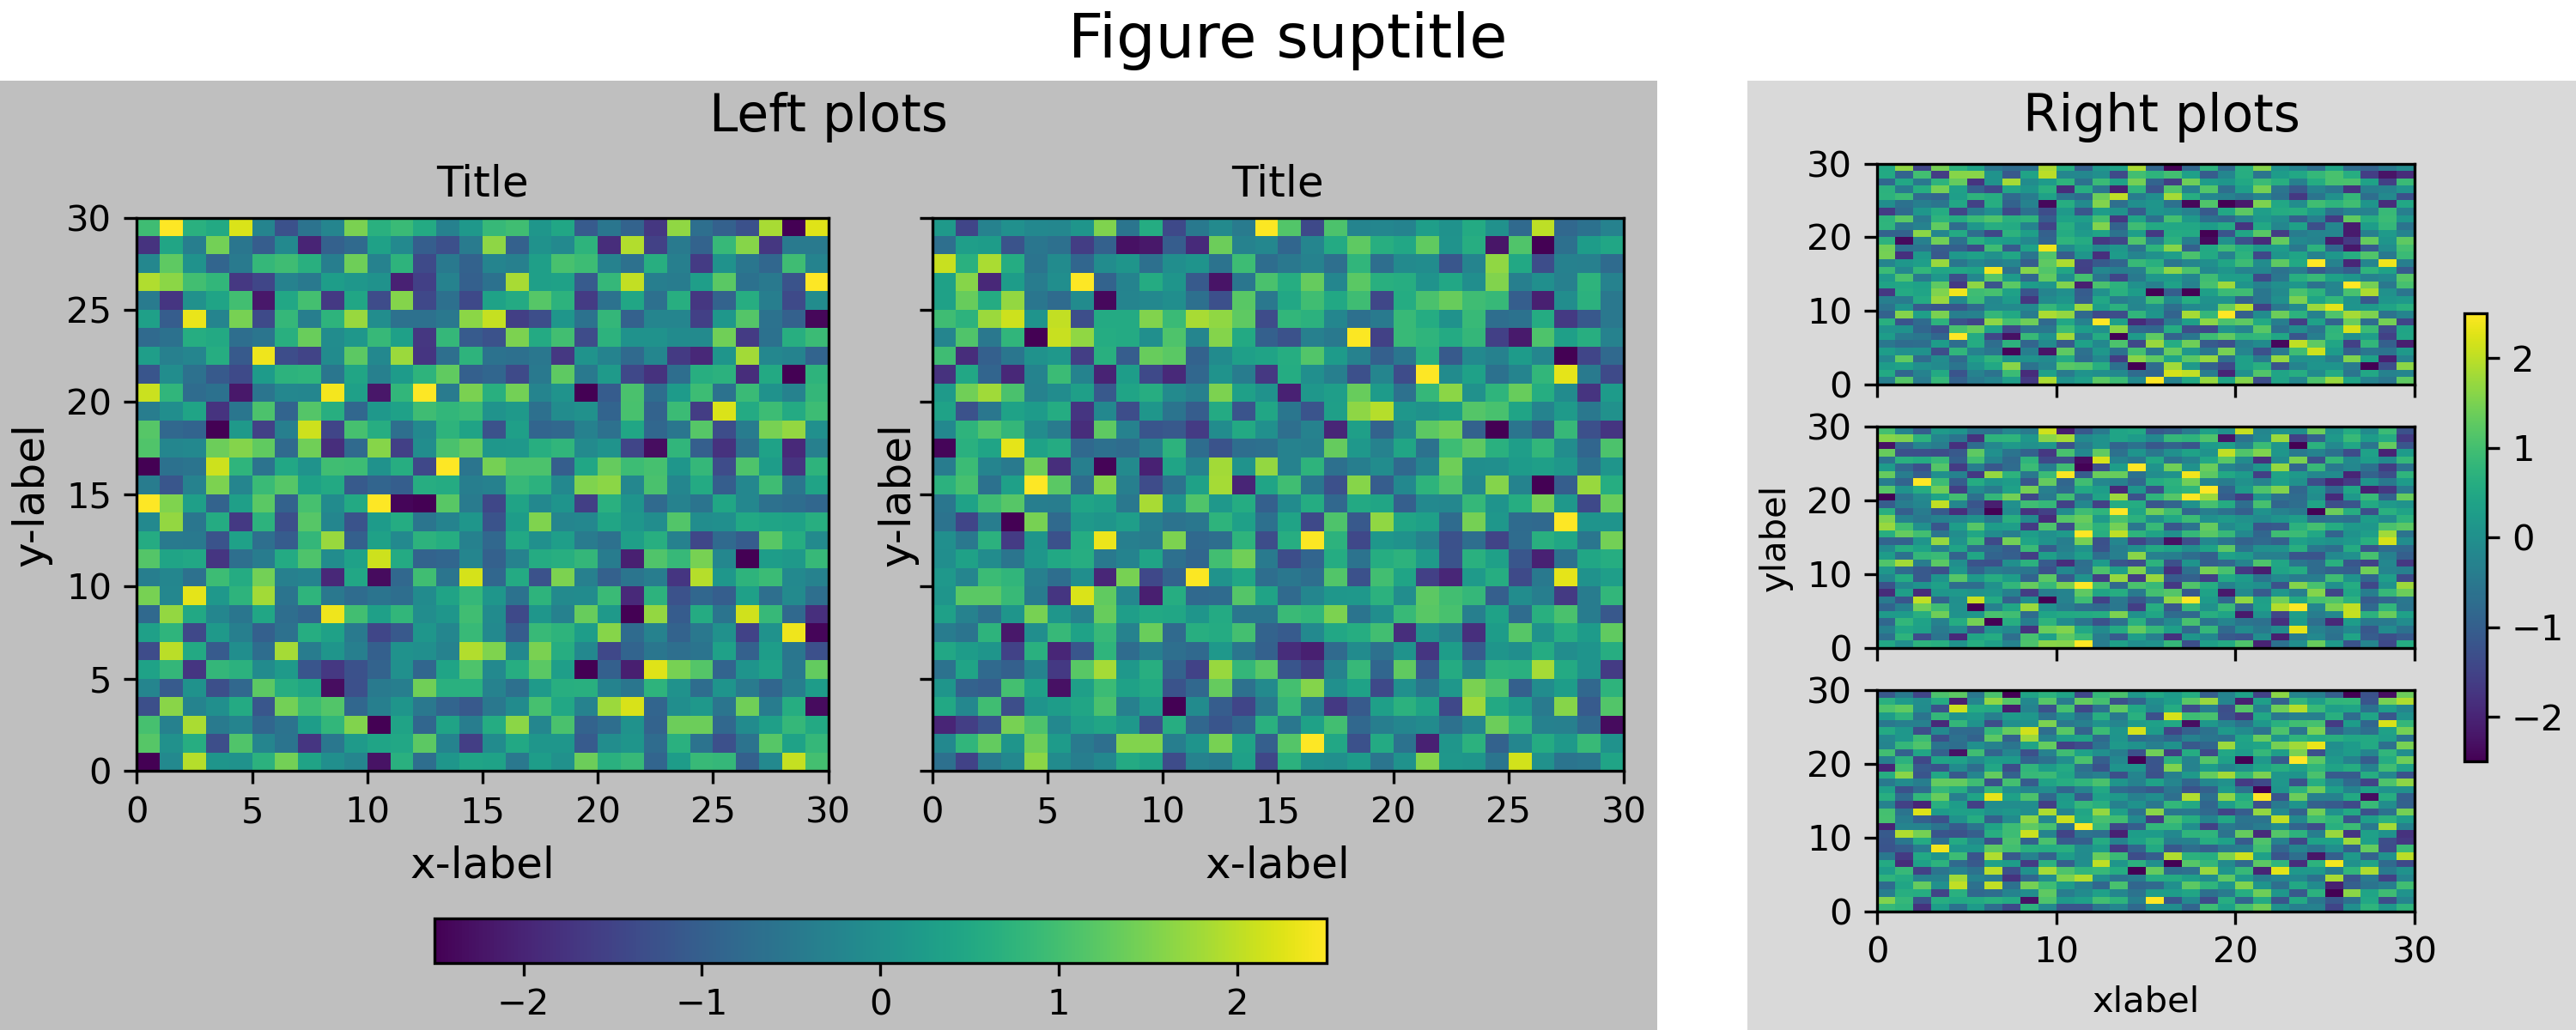
... # Subfigures can have different widths and heights. This is exactly the
... # same example as the first example, but *width_ratios* has been changed:
...
... fig = plt.figure(constrained_layout=True, figsize=(10, 4))
... subfigs = fig.subfigures(1, 2, wspace=0.07, width_ratios=[2, 1])
...
... axsLeft = subfigs[0].subplots(1, 2, sharey=True)
... subfigs[0].set_facecolor('0.75')
... for ax in axsLeft:
... pc = example_plot(ax)
... subfigs[0].suptitle('Left plots', fontsize='x-large')
... subfigs[0].colorbar(pc, shrink=0.6, ax=axsLeft, location='bottom')
...
... axsRight = subfigs[1].subplots(3, 1, sharex=True)
... for nn, ax in enumerate(axsRight):
... pc = example_plot(ax, hide_labels=True)
... if nn == 2:
... ax.set_xlabel('xlabel')
... if nn == 1:
... ax.set_ylabel('ylabel')
...
... subfigs[1].set_facecolor('0.85')
... subfigs[1].colorbar(pc, shrink=0.6, ax=axsRight)
... subfigs[1].suptitle('Right plots', fontsize='x-large')
...
... fig.suptitle('Figure suptitle', fontsize='xx-large')
...
... plt.show()
...
... ##############################################################################
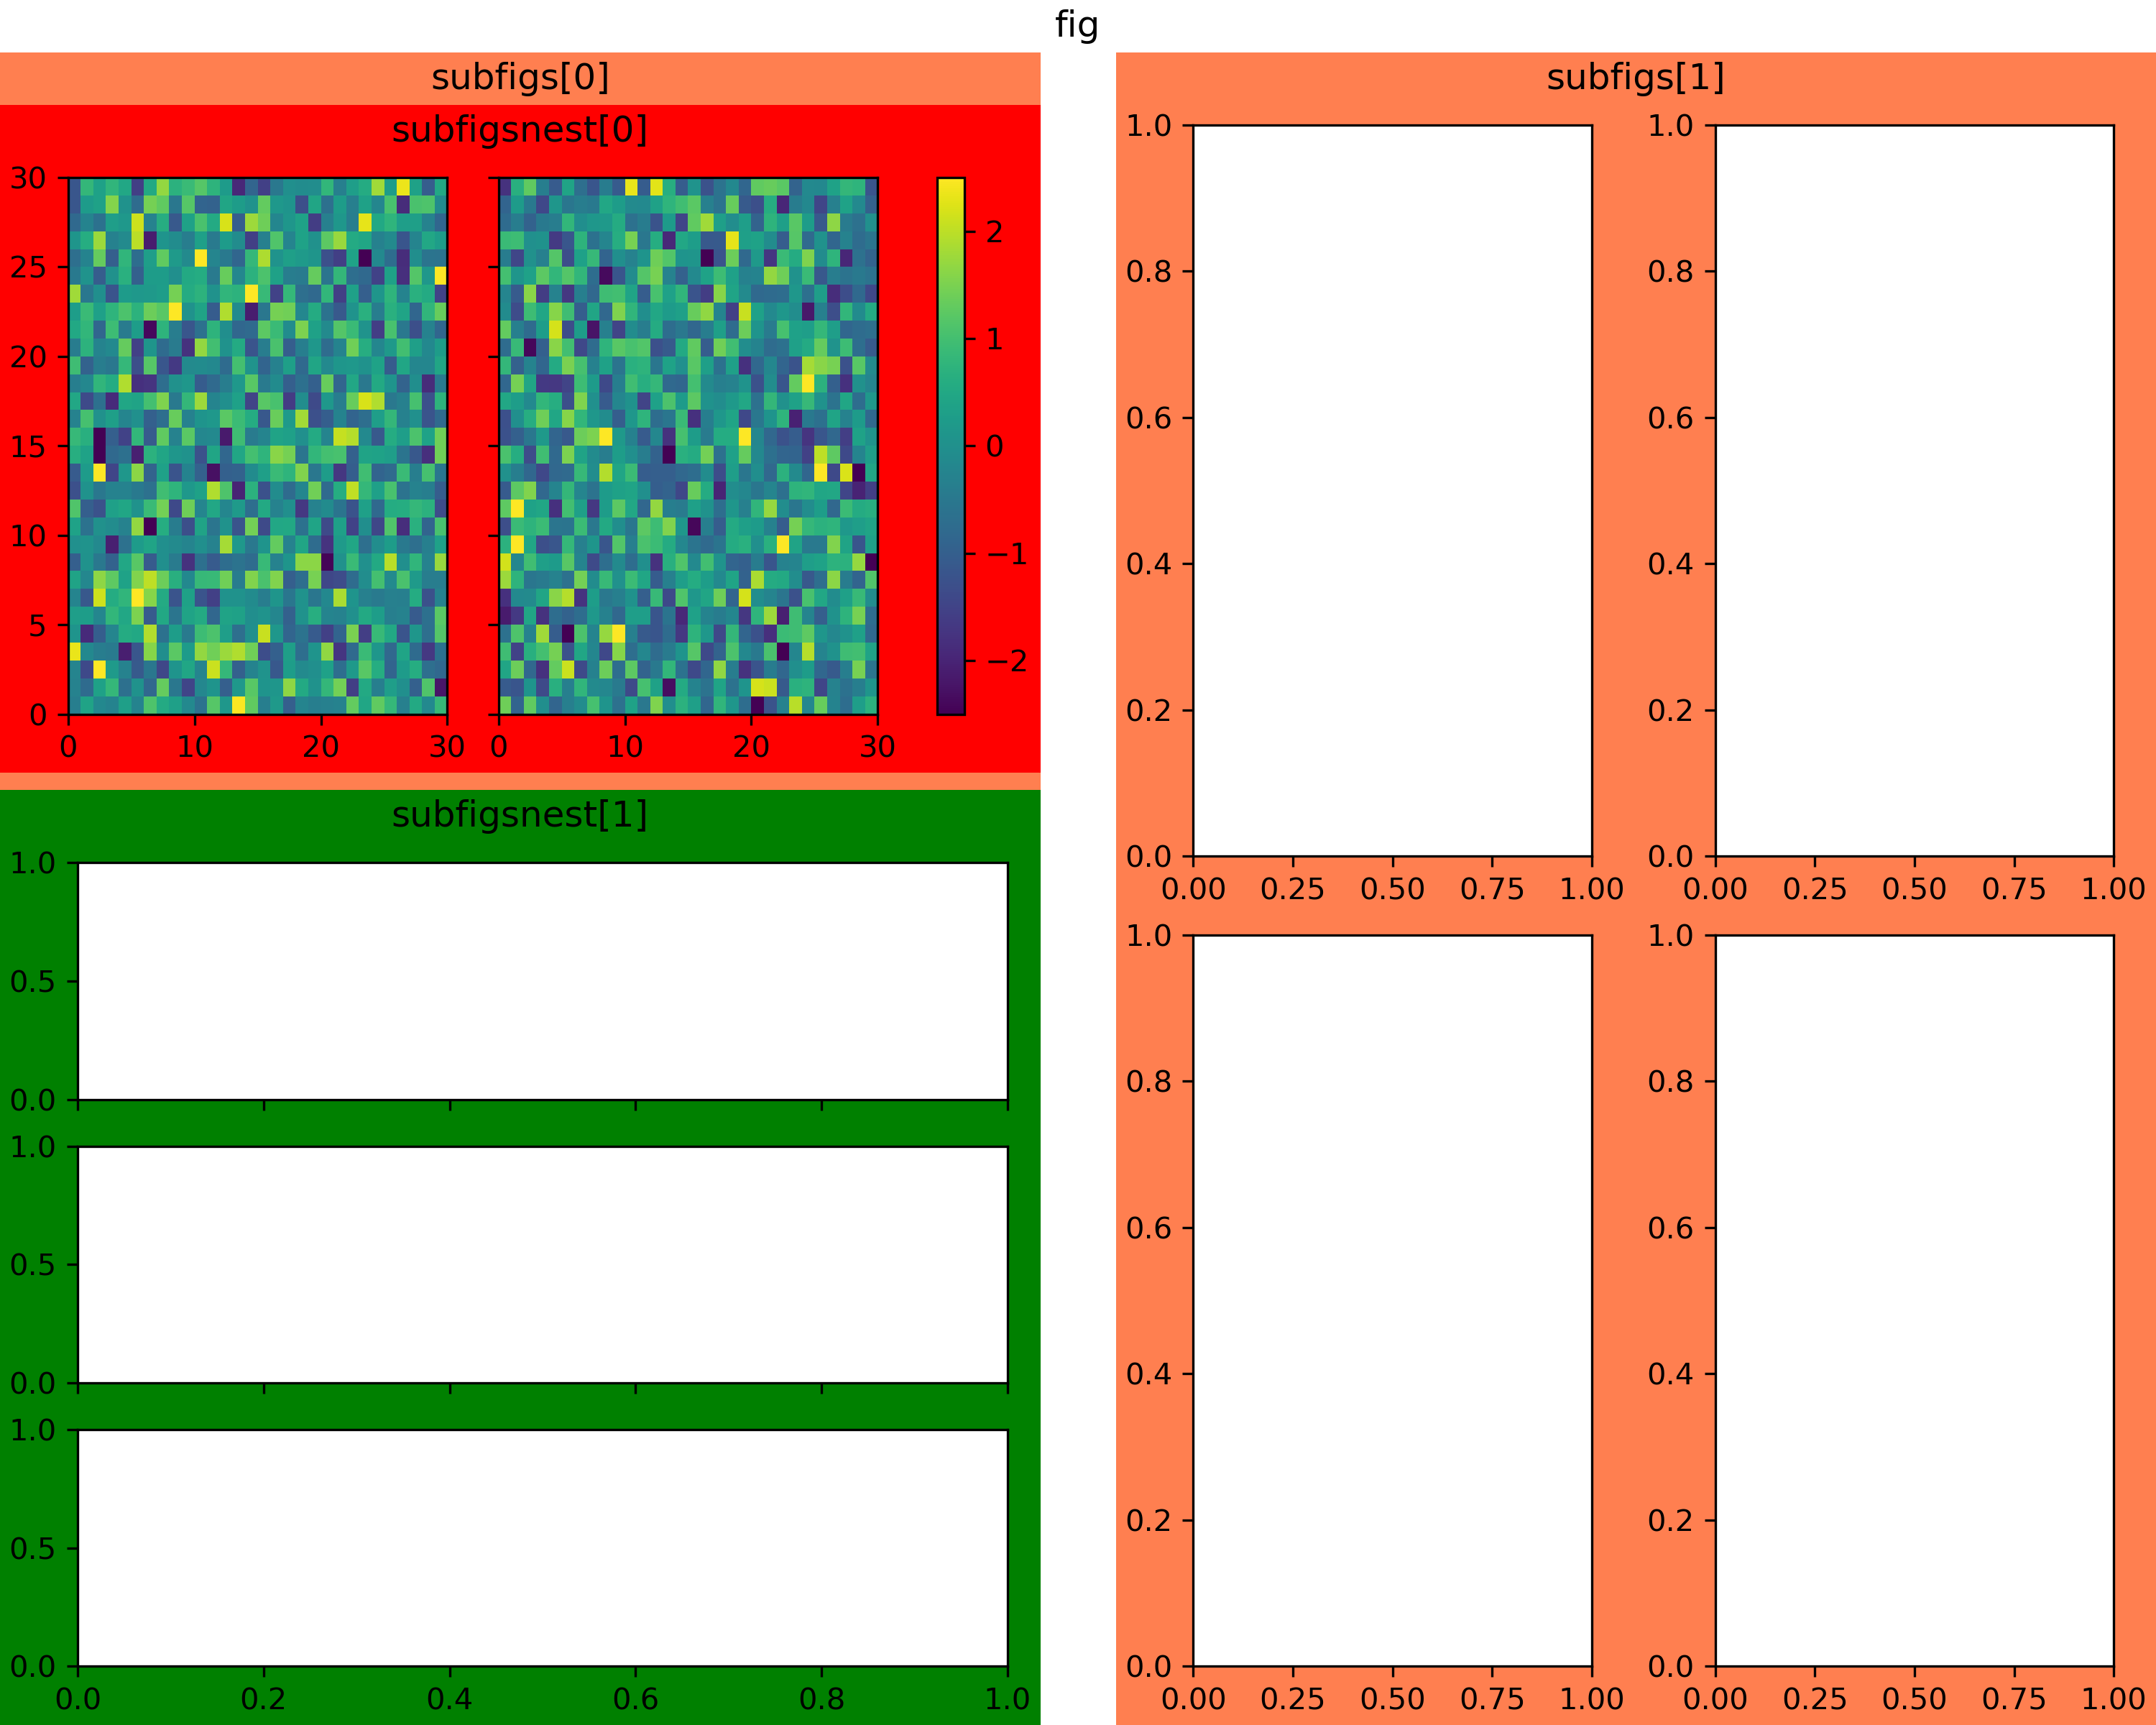
... # Subfigures can be also be nested:
...
... fig = plt.figure(constrained_layout=True, figsize=(10, 8))
...
... fig.suptitle('fig')
...
... subfigs = fig.subfigures(1, 2, wspace=0.07)
...
... subfigs[0].set_facecolor('coral')
... subfigs[0].suptitle('subfigs[0]')
...
... subfigs[1].set_facecolor('coral')
... subfigs[1].suptitle('subfigs[1]')
...
... subfigsnest = subfigs[0].subfigures(2, 1, height_ratios=[1, 1.4])
... subfigsnest[0].suptitle('subfigsnest[0]')
... subfigsnest[0].set_facecolor('r')
... axsnest0 = subfigsnest[0].subplots(1, 2, sharey=True)
... for nn, ax in enumerate(axsnest0):
... pc = example_plot(ax, hide_labels=True)
... subfigsnest[0].colorbar(pc, ax=axsnest0)
...
... subfigsnest[1].suptitle('subfigsnest[1]')
... subfigsnest[1].set_facecolor('g')
... axsnest1 = subfigsnest[1].subplots(3, 1, sharex=True)
...
... axsRight = subfigs[1].subplots(2, 2)
...
... plt.show()
...