>>> """
=========
Step Demo
=========
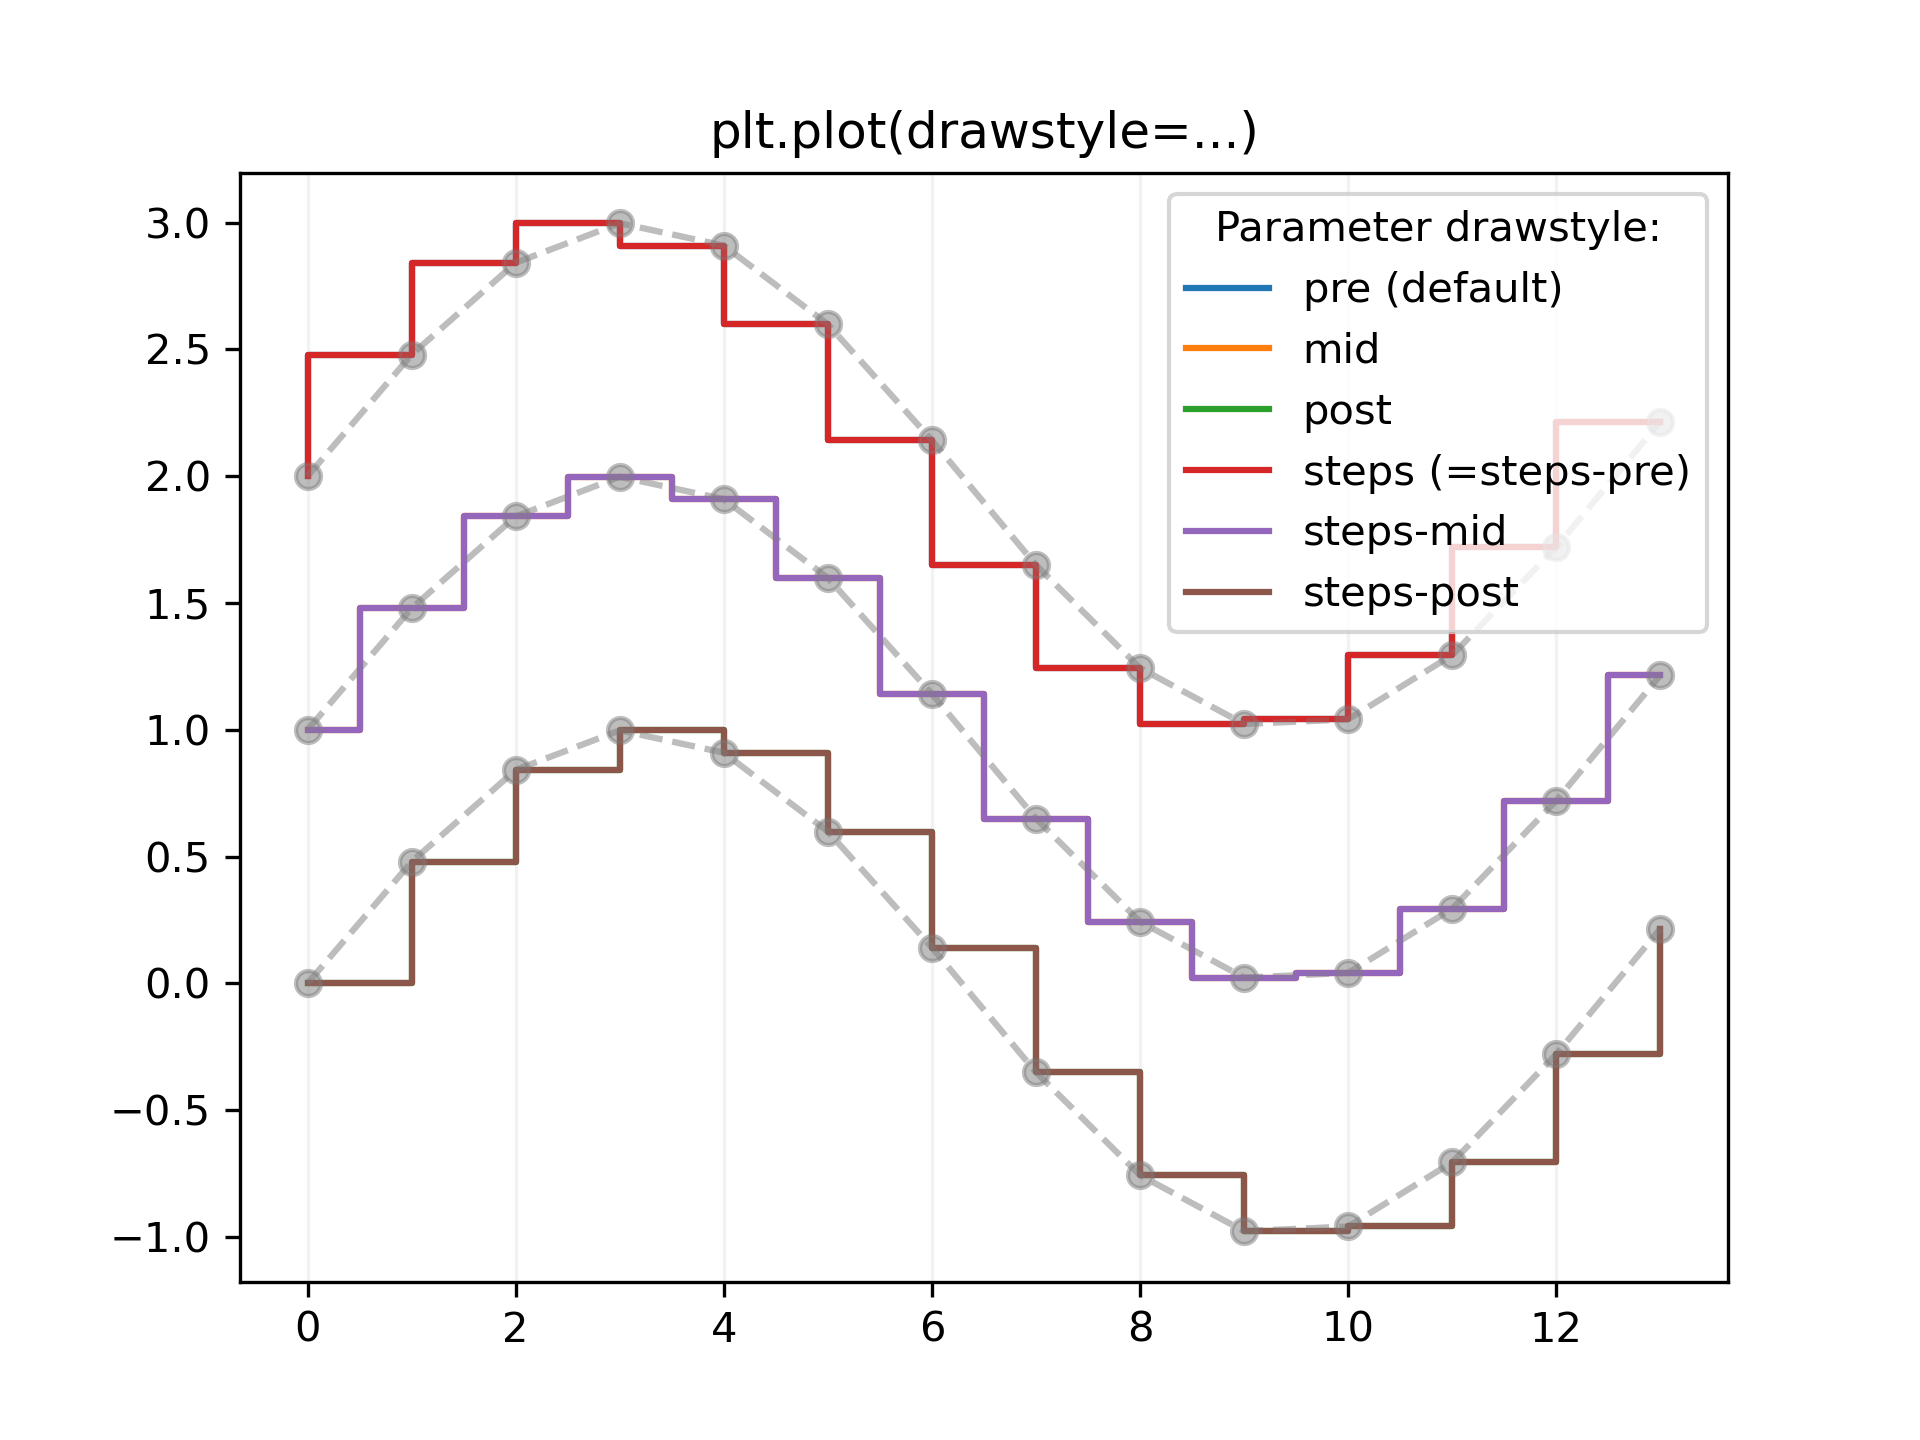
This example demonstrates the use of `.pyplot.step` for piece-wise constant
curves. In particular, it illustrates the effect of the parameter *where*
on the step position.
.. note::
For the common case that you know the edge positions, use `.pyplot.stairs`
instead.
The circular markers created with `.pyplot.plot` show the actual data
positions so that it's easier to see the effect of *where*.
"""
... import numpy as np
... import matplotlib.pyplot as plt
...
... x = np.arange(14)
... y = np.sin(x / 2)
...
... plt.step(x, y + 2, label='pre (default)')
... plt.plot(x, y + 2, 'o--', color='grey', alpha=0.3)
...
... plt.step(x, y + 1, where='mid', label='mid')
... plt.plot(x, y + 1, 'o--', color='grey', alpha=0.3)
...
... plt.step(x, y, where='post', label='post')
... plt.plot(x, y, 'o--', color='grey', alpha=0.3)
...
... plt.grid(axis='x', color='0.95')
... plt.legend(title='Parameter where:')
... plt.title('plt.step(where=...)')
... plt.show()
...
... #############################################################################
... # The same behavior can be achieved by using the ``drawstyle`` parameter of
... # `.pyplot.plot`.
...
... plt.plot(x, y + 2, drawstyle='steps', label='steps (=steps-pre)')
... plt.plot(x, y + 2, 'o--', color='grey', alpha=0.3)
...
... plt.plot(x, y + 1, drawstyle='steps-mid', label='steps-mid')
... plt.plot(x, y + 1, 'o--', color='grey', alpha=0.3)
...
... plt.plot(x, y, drawstyle='steps-post', label='steps-post')
... plt.plot(x, y, 'o--', color='grey', alpha=0.3)
...
... plt.grid(axis='x', color='0.95')
... plt.legend(title='Parameter drawstyle:')
... plt.title('plt.plot(drawstyle=...)')
... plt.show()
...
... #############################################################################
... #
... # .. admonition:: References
... #
... # The use of the following functions, methods, classes and modules is shown
... # in this example:
... #
... # - `matplotlib.axes.Axes.step` / `matplotlib.pyplot.step`
... # - `matplotlib.axes.Axes.plot` / `matplotlib.pyplot.plot`
...