>>> """
=======
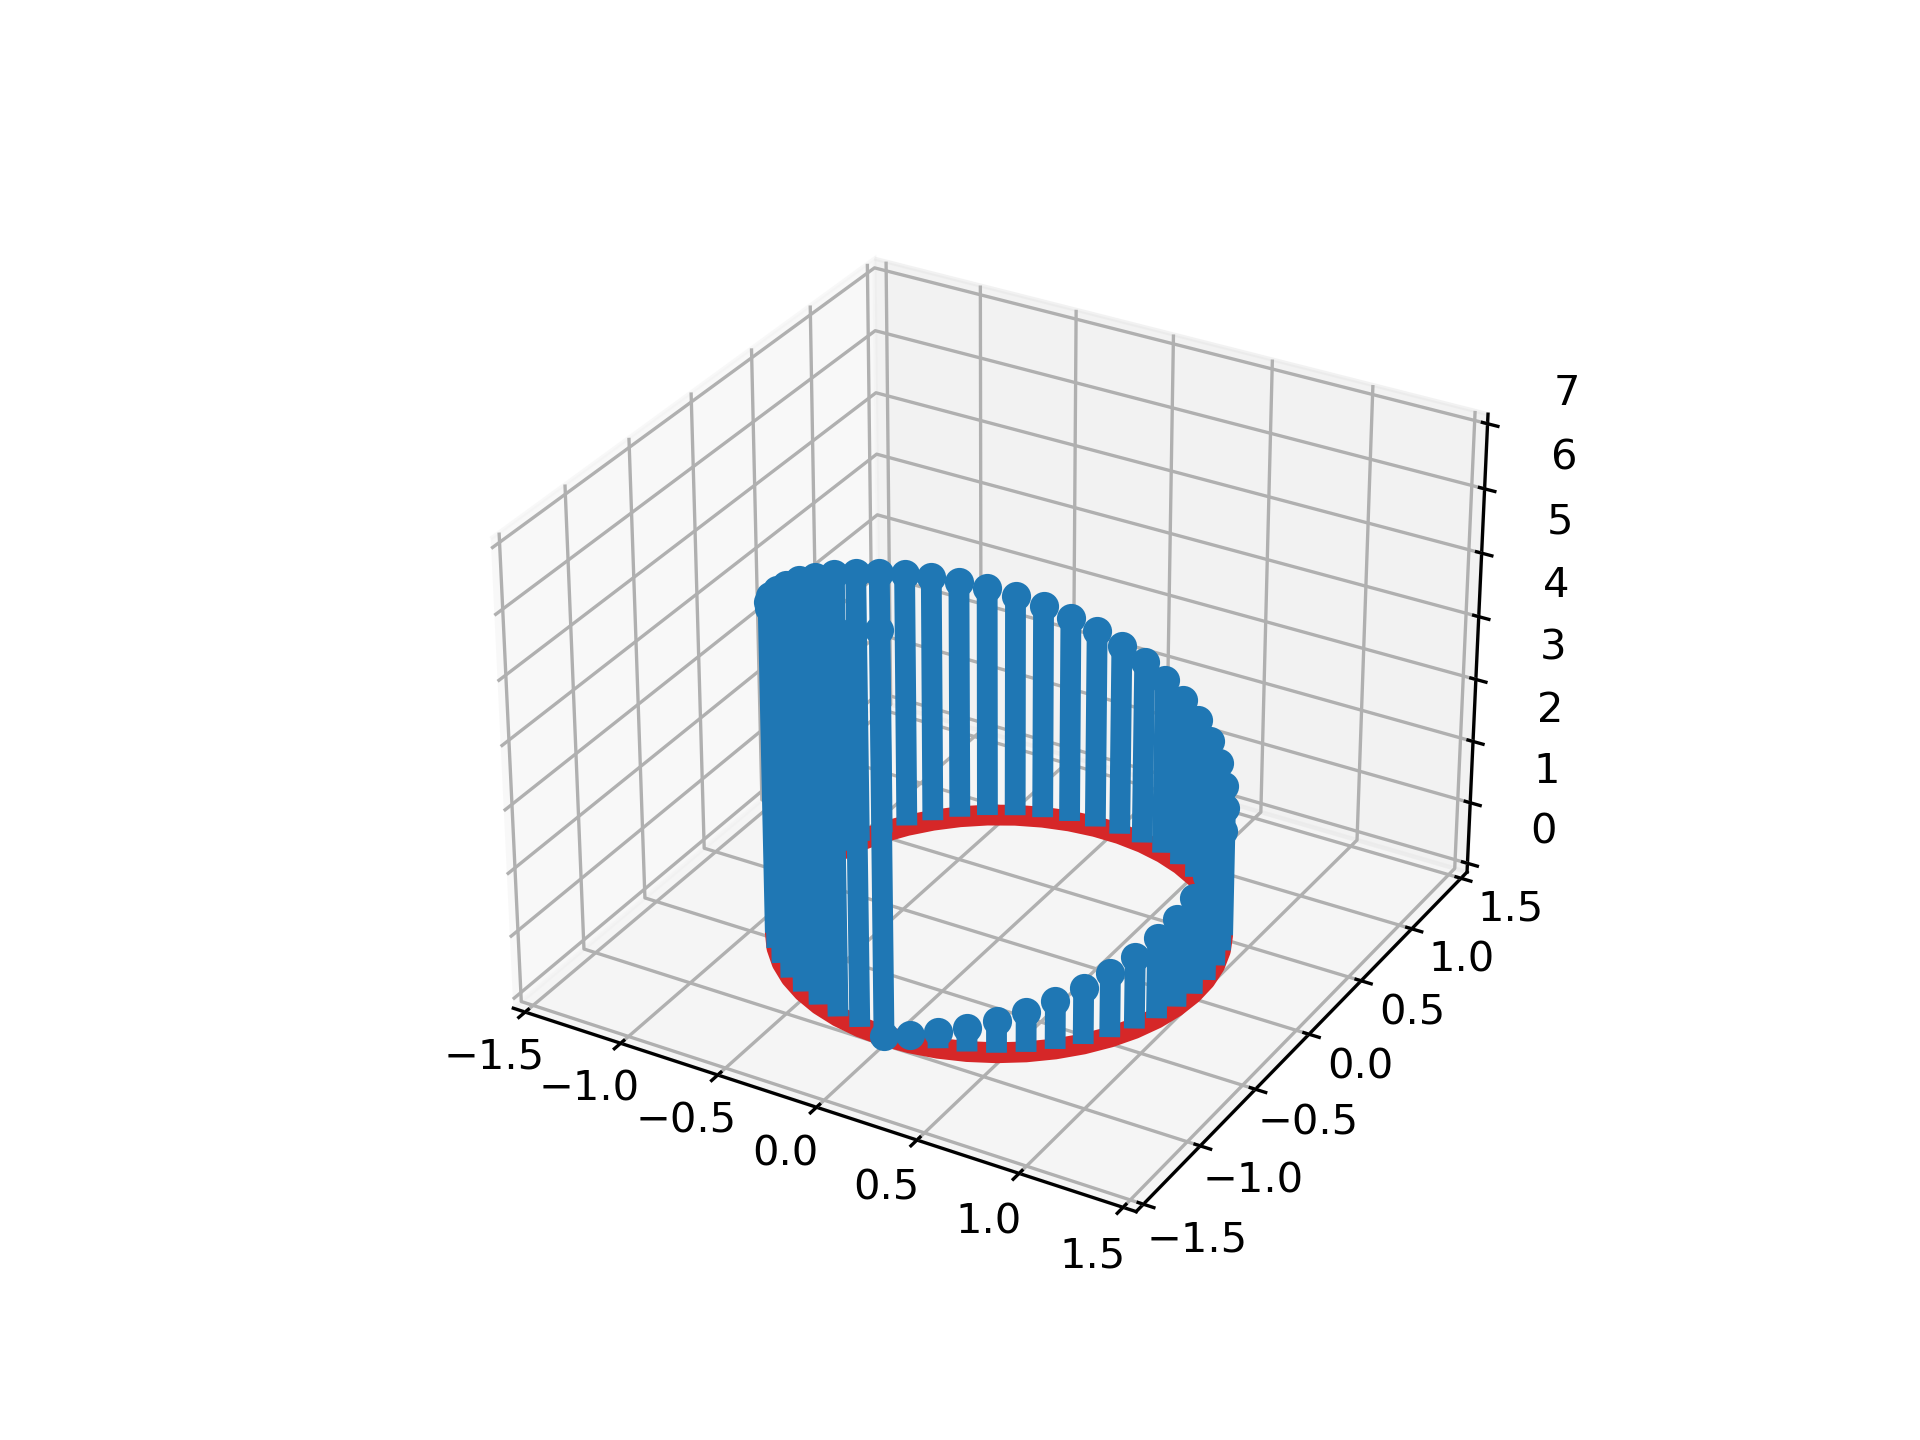
3D stem
=======
Demonstration of a stem plot in 3D, which plots vertical lines from a baseline
to the *z*-coordinate and places a marker at the tip.
"""
...
... import matplotlib.pyplot as plt
... import numpy as np
...
... theta = np.linspace(0, 2*np.pi)
... x = np.cos(theta - np.pi/2)
... y = np.sin(theta - np.pi/2)
... z = theta
...
... fig, ax = plt.subplots(subplot_kw=dict(projection='3d'))
... ax.stem(x, y, z)
...
... plt.show()
...
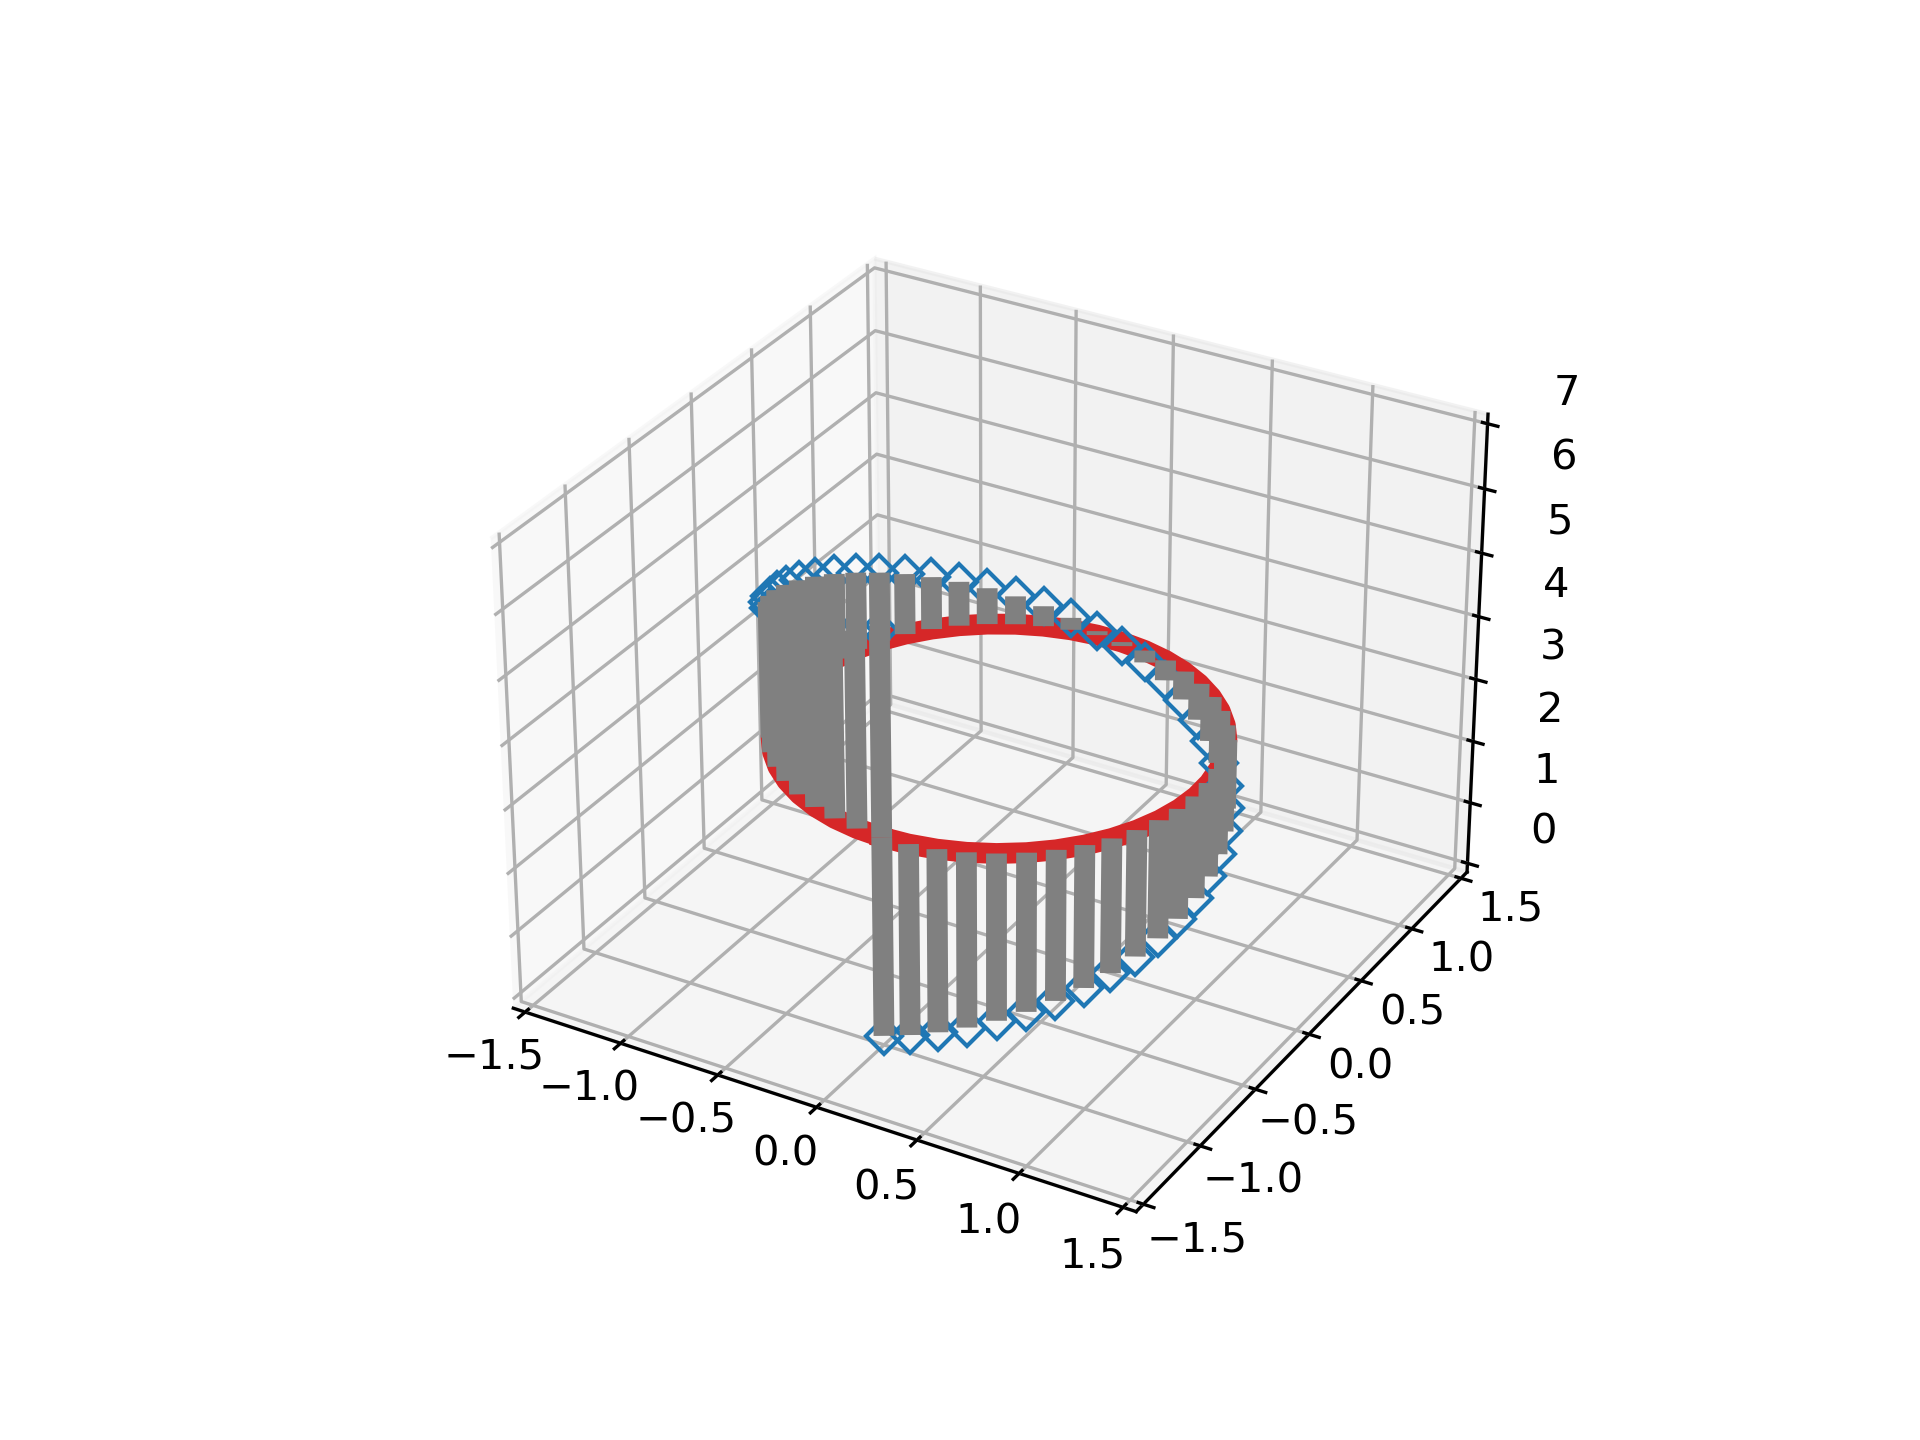
... #############################################################################
... #
... # The position of the baseline can be adapted using *bottom*. The parameters
... # *linefmt*, *markerfmt*, and *basefmt* control basic format properties of the
... # plot. However, in contrast to `~.axes3d.Axes3D.plot` not all properties are
... # configurable via keyword arguments. For more advanced control adapt the line
... # objects returned by `.stem3D`.
...
... fig, ax = plt.subplots(subplot_kw=dict(projection='3d'))
... markerline, stemlines, baseline = ax.stem(
... x, y, z, linefmt='grey', markerfmt='D', bottom=np.pi)
... markerline.set_markerfacecolor('none')
...
... plt.show()
...
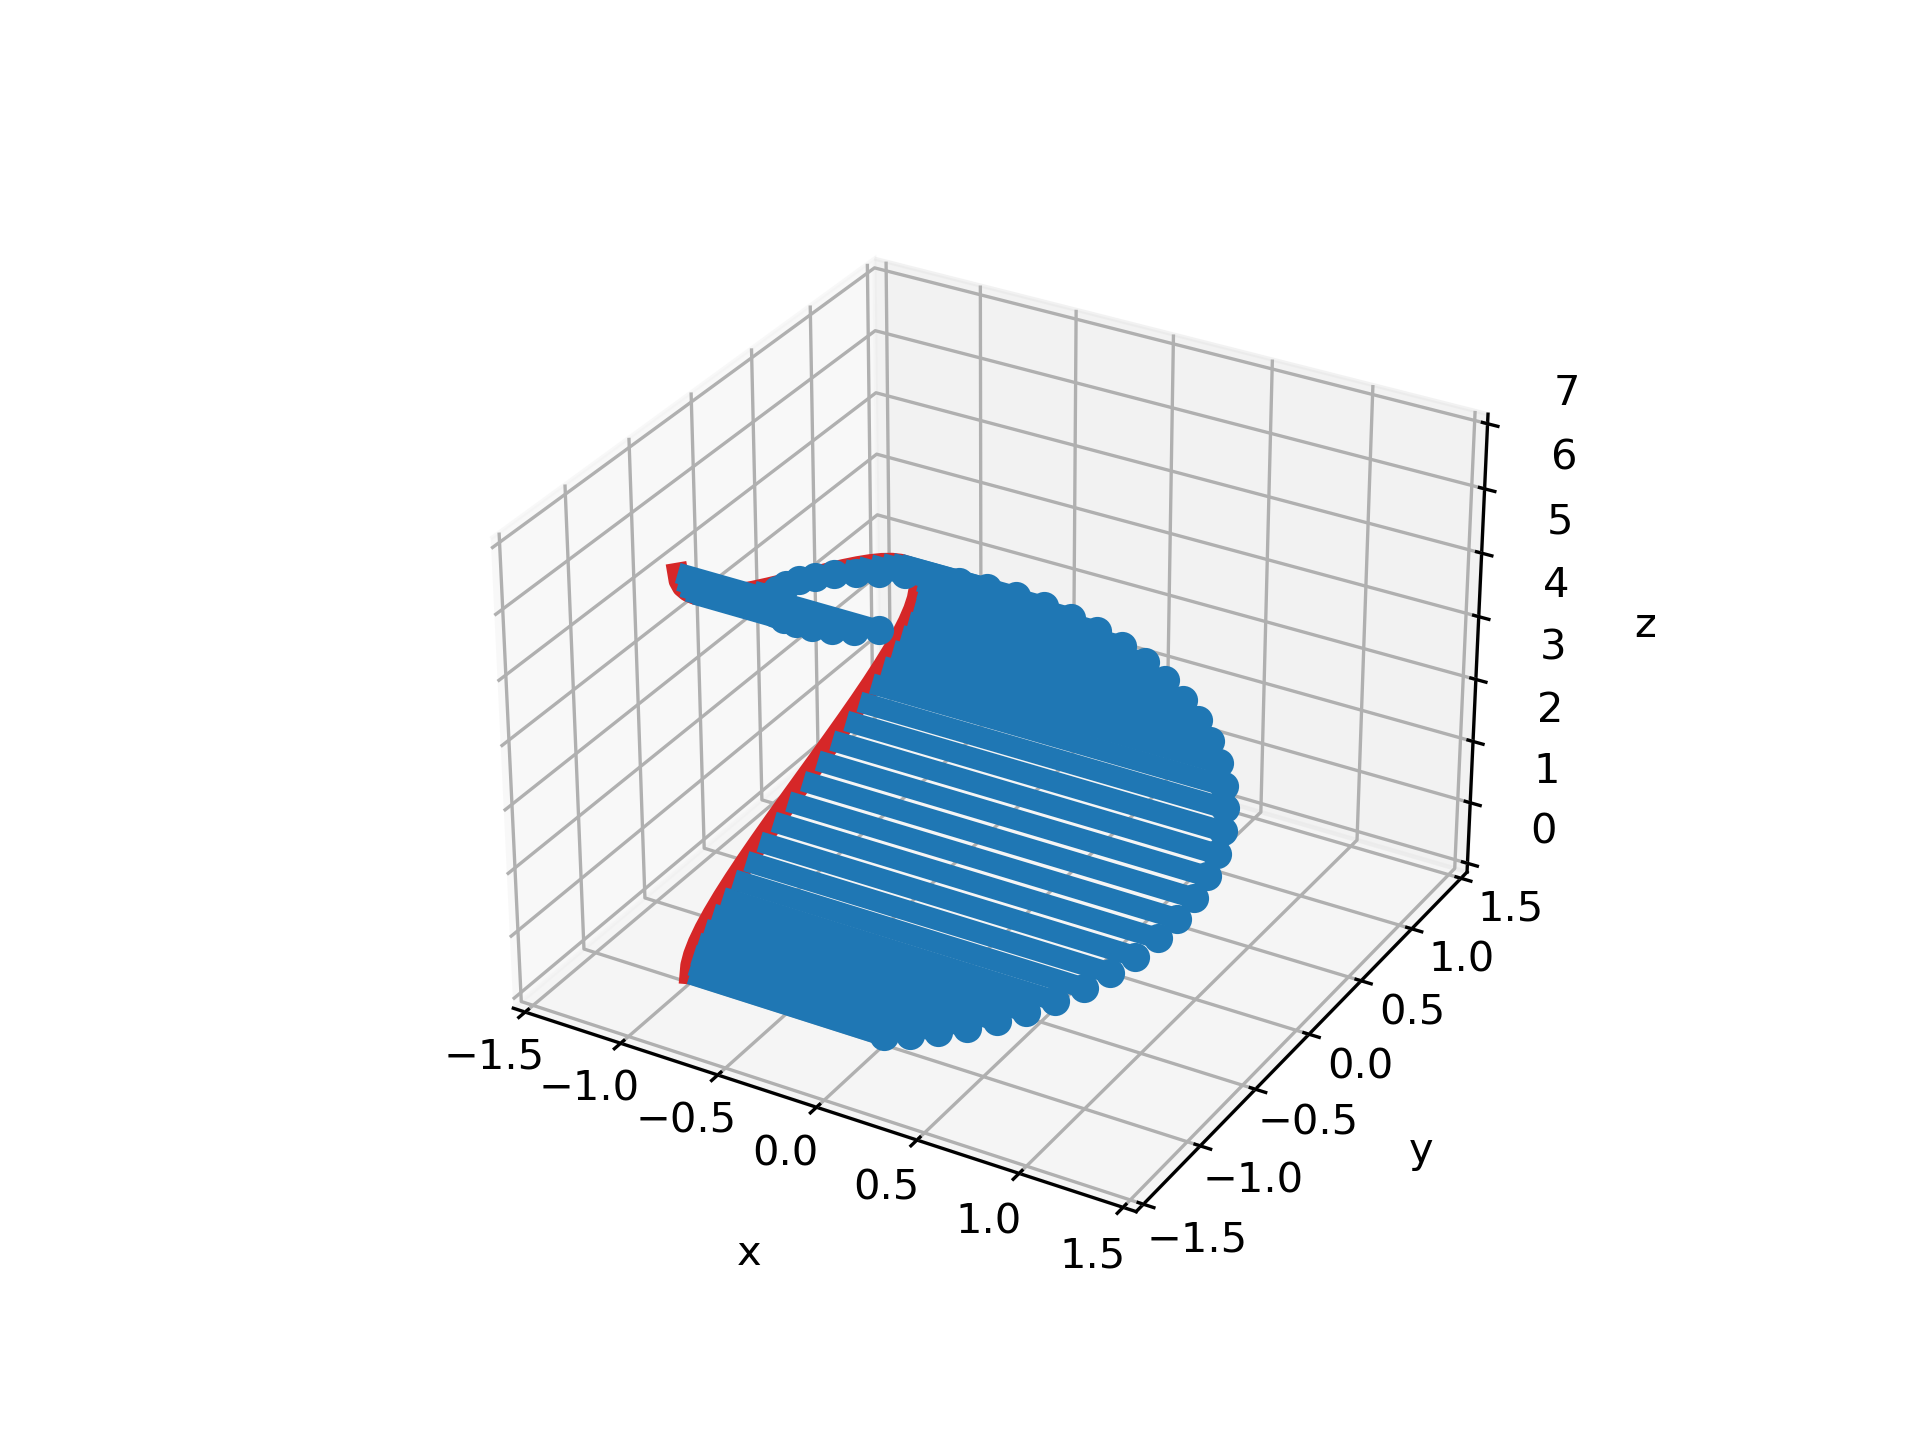
... #############################################################################
... #
... # The orientation of the stems and baseline can be changed using *orientation*.
... # This determines in which direction the stems are projected from the head
... # points, towards the *bottom* baseline.
... #
... # For examples, by setting ``orientation='x'``, the stems are projected along
... # the *x*-direction, and the baseline is in the *yz*-plane.
...
... fig, ax = plt.subplots(subplot_kw=dict(projection='3d'))
... markerline, stemlines, baseline = ax.stem(x, y, z, bottom=-1, orientation='x')
... ax.set(xlabel='x', ylabel='y', zlabel='z')
...
... plt.show()
...