>>> """
===========================
Stackplots and streamgraphs
===========================
"""
...
... ##############################################################################
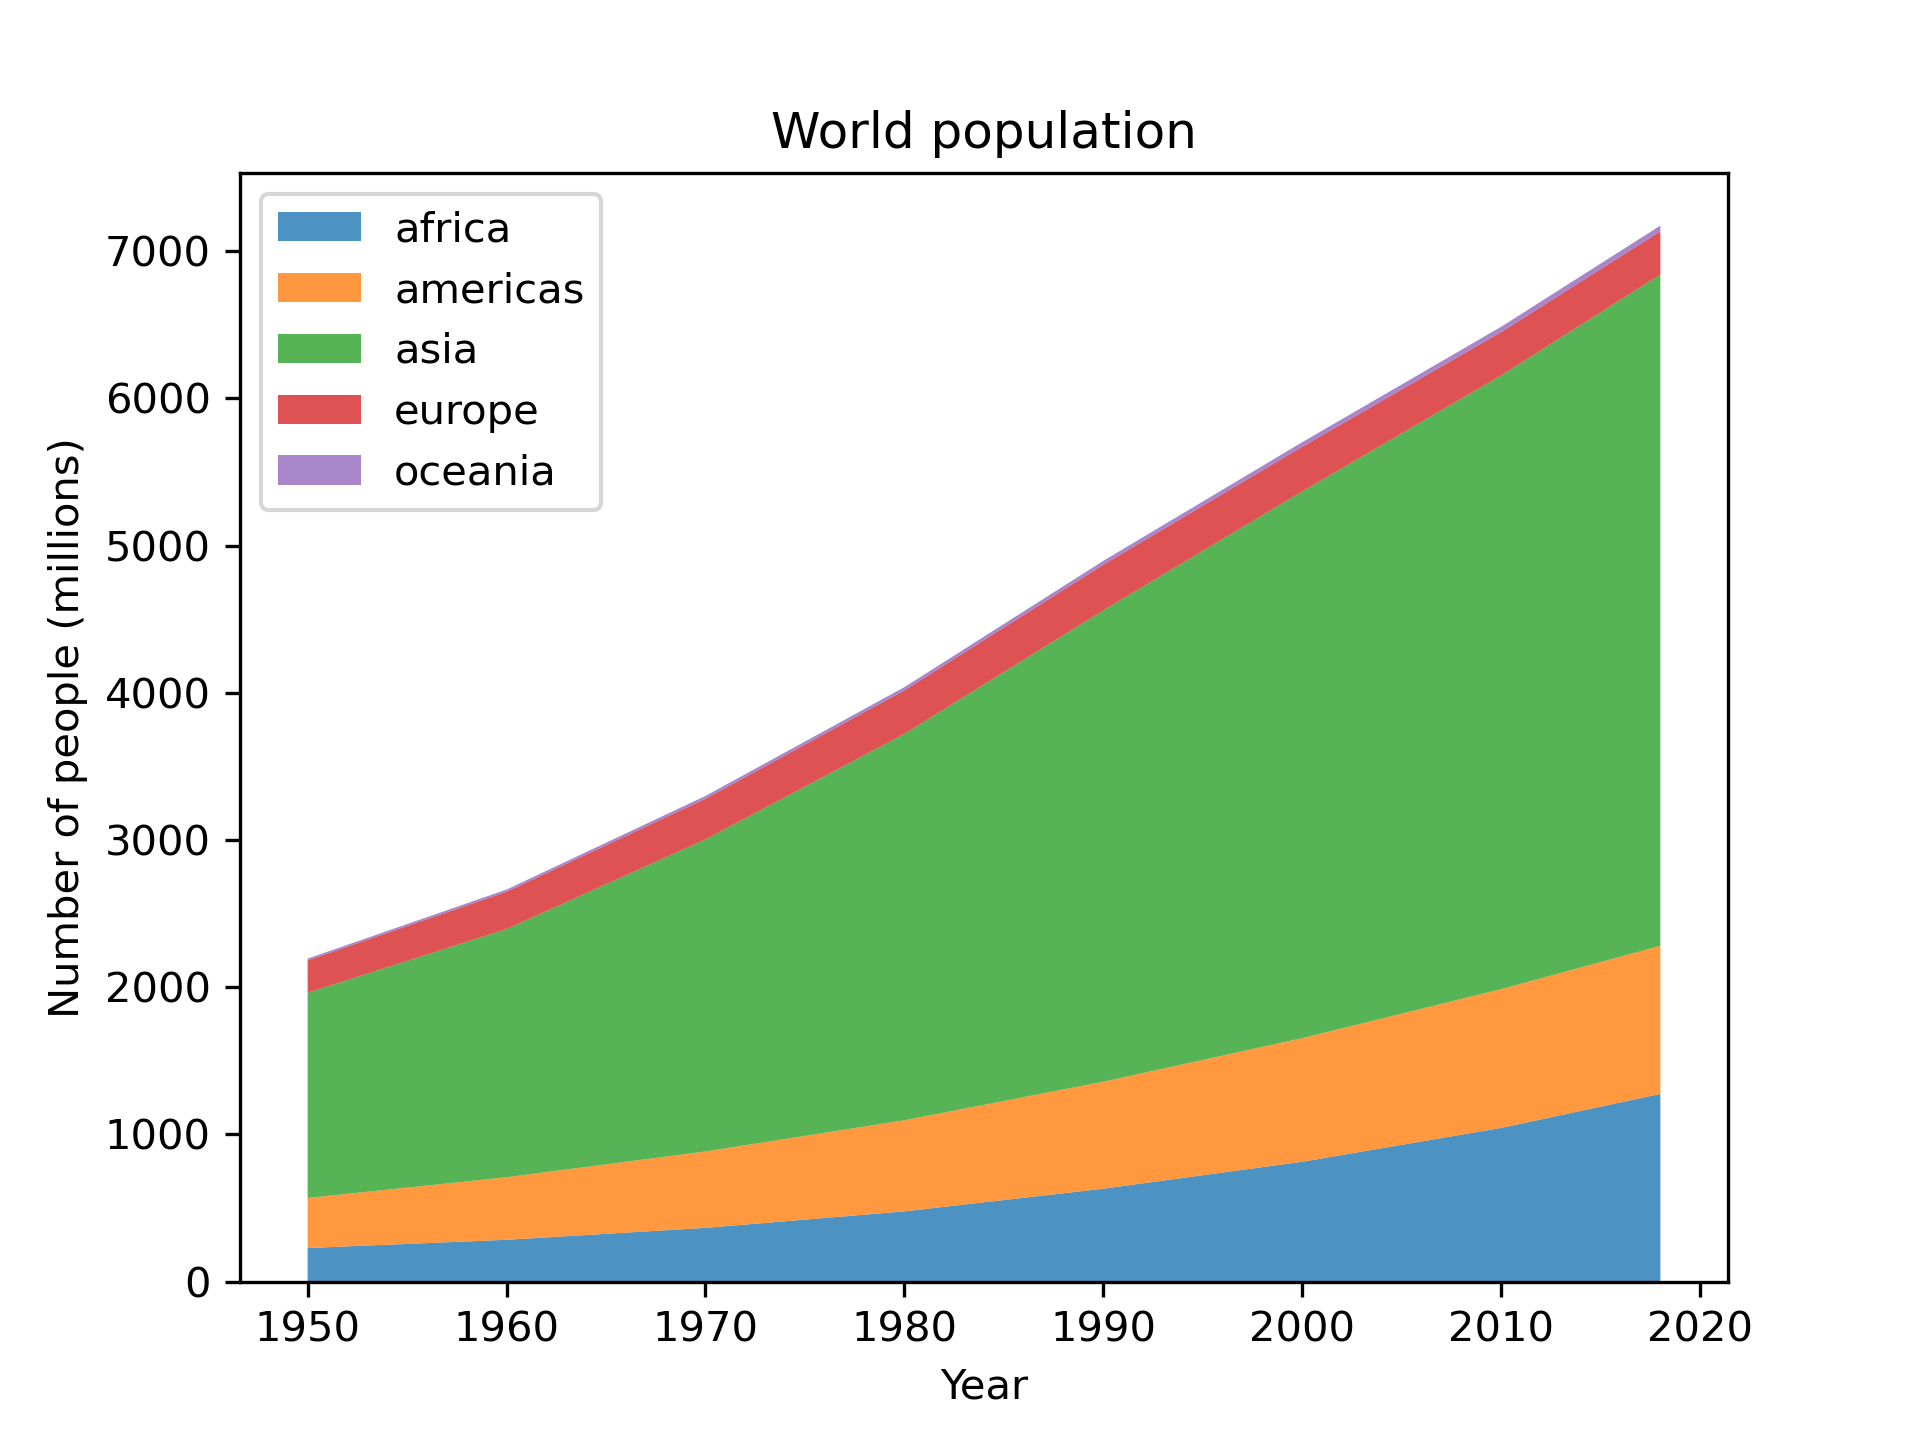
... # Stackplots
... # ----------
... #
... # Stackplots draw multiple datasets as vertically stacked areas. This is
... # useful when the individual data values and additionally their cumulative
... # value are of interest.
...
...
... import numpy as np
... import matplotlib.pyplot as plt
...
... # data from United Nations World Population Prospects (Revision 2019)
... # https://population.un.org/wpp/, license: CC BY 3.0 IGO
... year = [1950, 1960, 1970, 1980, 1990, 2000, 2010, 2018]
... population_by_continent = {
... 'africa': [228, 284, 365, 477, 631, 814, 1044, 1275],
... 'americas': [340, 425, 519, 619, 727, 840, 943, 1006],
... 'asia': [1394, 1686, 2120, 2625, 3202, 3714, 4169, 4560],
... 'europe': [220, 253, 276, 295, 310, 303, 294, 293],
... 'oceania': [12, 15, 19, 22, 26, 31, 36, 39],
... }
...
... fig, ax = plt.subplots()
... ax.stackplot(year, population_by_continent.values(),
... labels=population_by_continent.keys(), alpha=0.8)
... ax.legend(loc='upper left')
... ax.set_title('World population')
... ax.set_xlabel('Year')
... ax.set_ylabel('Number of people (millions)')
...
... plt.show()
...
... ##############################################################################
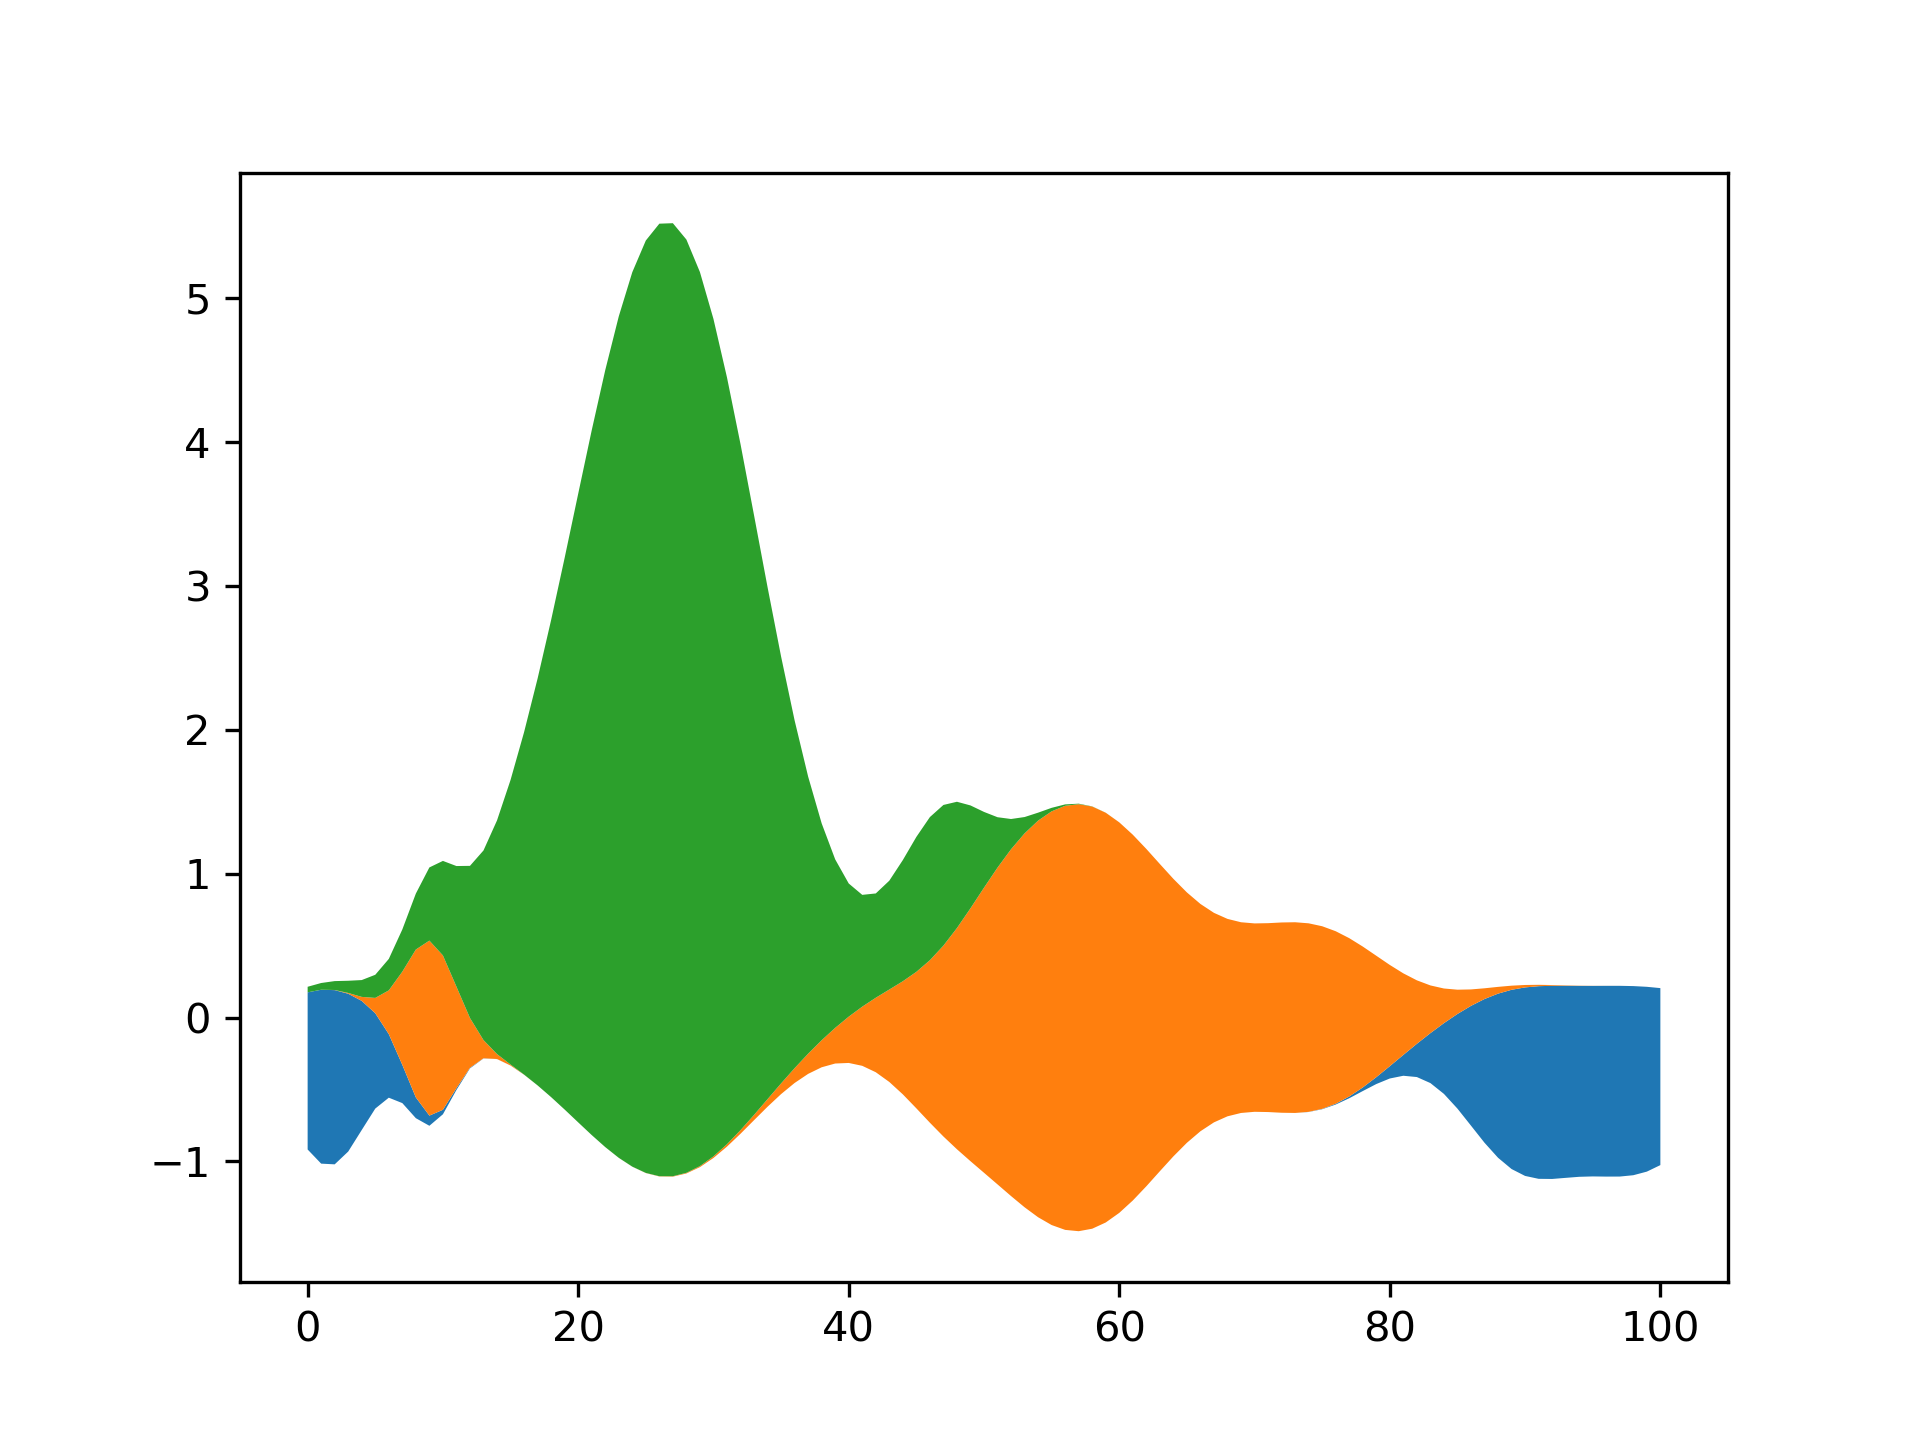
... # Streamgraphs
... # ------------
... #
... # Using the *baseline* parameter, you can turn an ordinary stacked area plot
... # with baseline 0 into a stream graph.
...
...
... # Fixing random state for reproducibility
... np.random.seed(19680801)
...
...
... def gaussian_mixture(x, n=5):
... """Return a random mixture of *n* Gaussians, evaluated at positions *x*."""
... def add_random_gaussian(a):
... amplitude = 1 / (.1 + np.random.random())
... dx = x[-1] - x[0]
... x0 = (2 * np.random.random() - .5) * dx
... z = 10 / (.1 + np.random.random()) / dx
... a += amplitude * np.exp(-(z * (x - x0))**2)
... a = np.zeros_like(x)
... for j in range(n):
... add_random_gaussian(a)
... return a
...
...
... x = np.linspace(0, 100, 101)
... ys = [gaussian_mixture(x) for _ in range(3)]
...
... fig, ax = plt.subplots()
... ax.stackplot(x, ys, baseline='wiggle')
... plt.show()
...