>>> """
=========
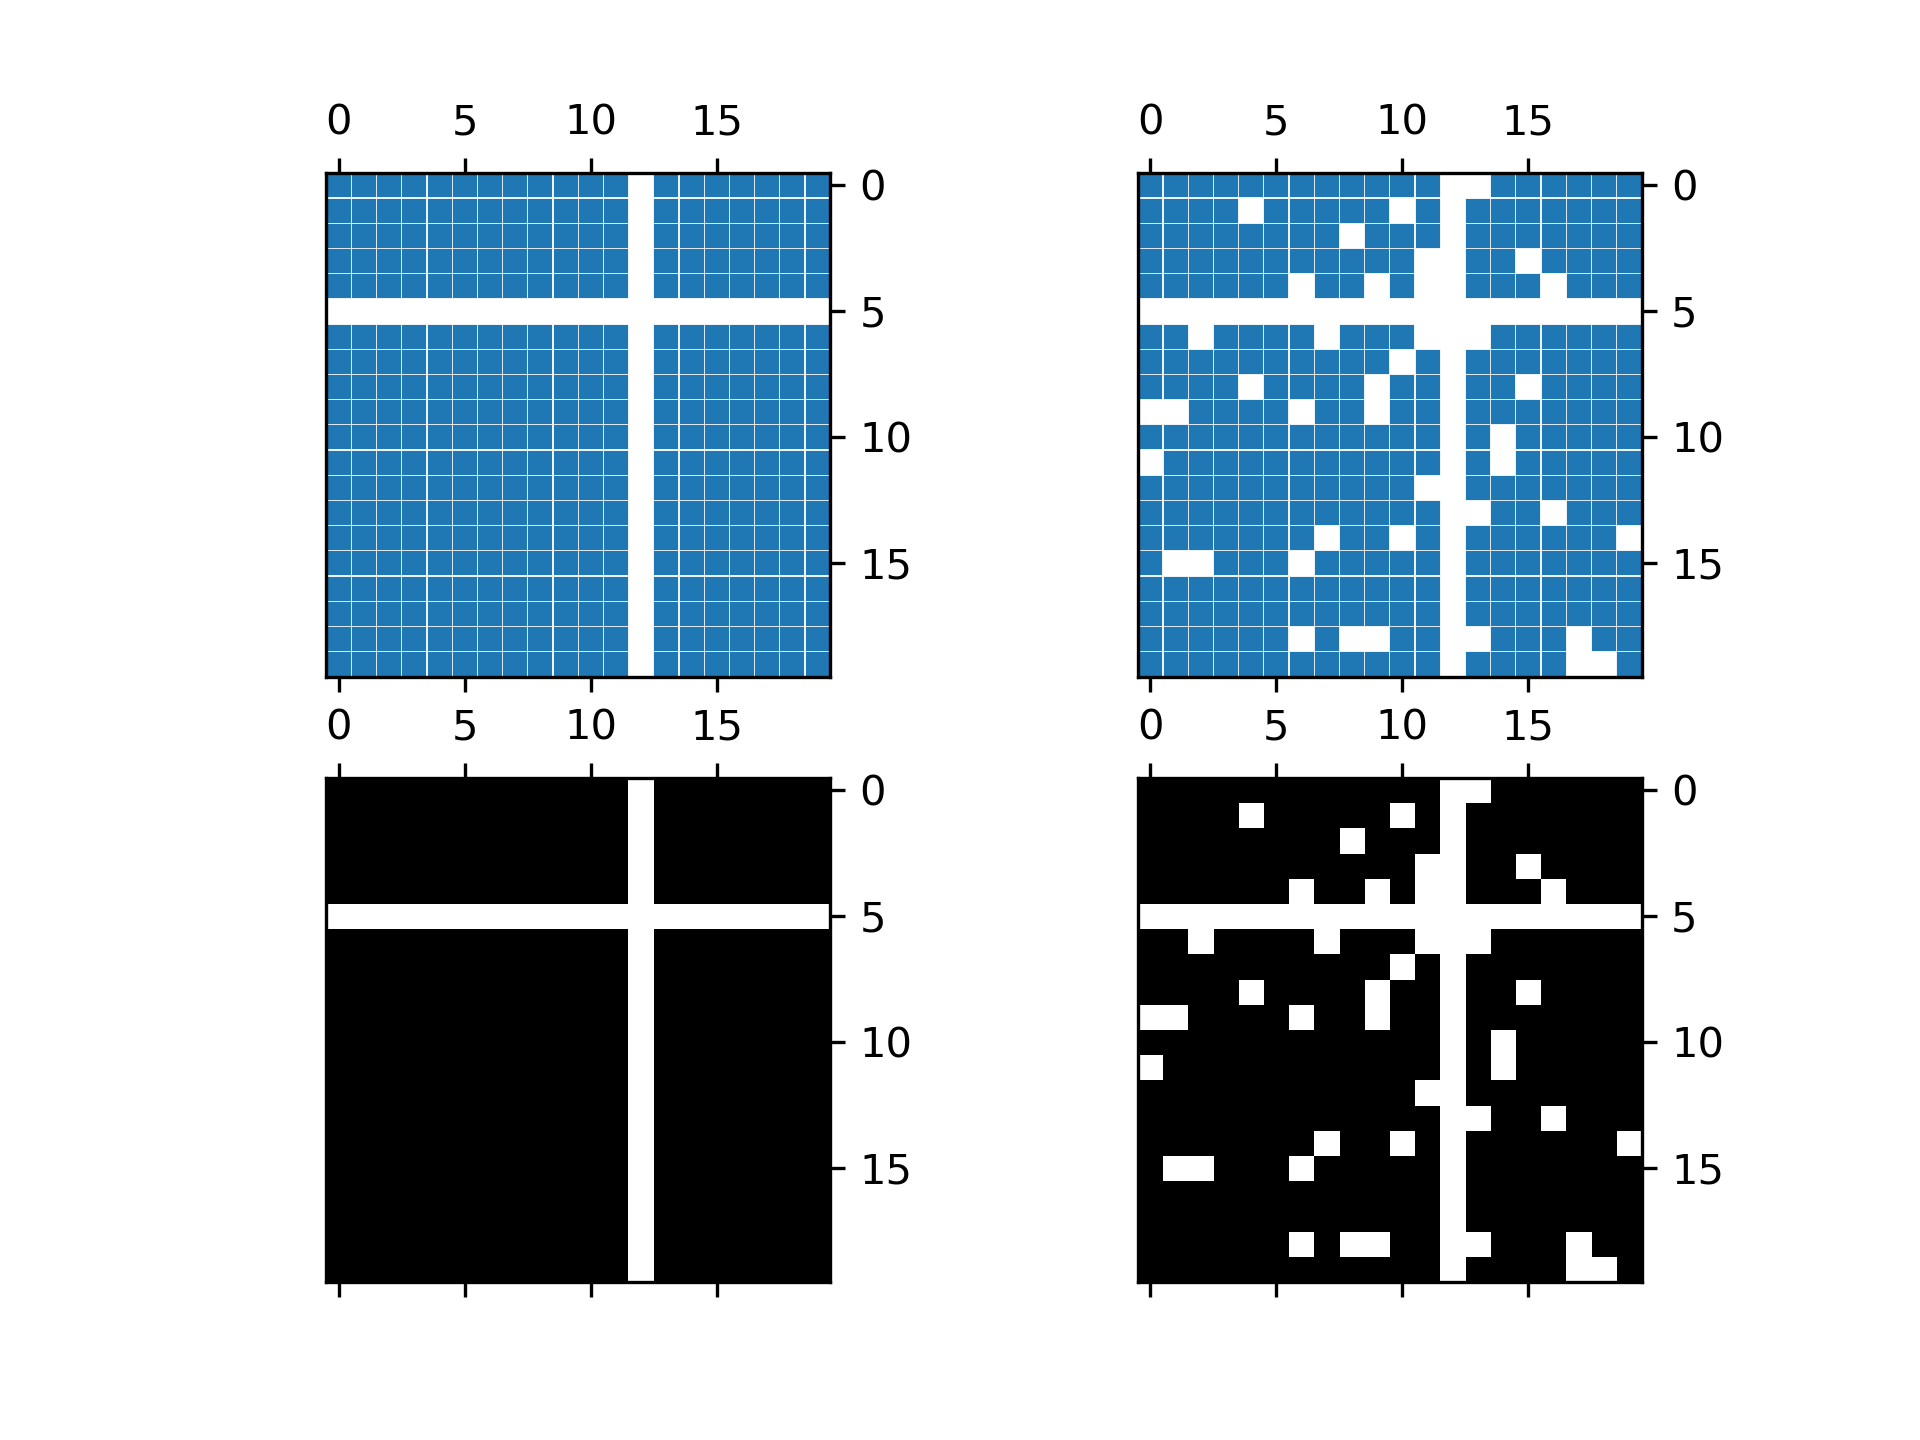
Spy Demos
=========
Plot the sparsity pattern of arrays.
"""
...
... import matplotlib.pyplot as plt
... import numpy as np
...
...
... # Fixing random state for reproducibility
... np.random.seed(19680801)
...
... fig, axs = plt.subplots(2, 2)
... ax1 = axs[0, 0]
... ax2 = axs[0, 1]
... ax3 = axs[1, 0]
... ax4 = axs[1, 1]
...
... x = np.random.randn(20, 20)
... x[5, :] = 0.
... x[:, 12] = 0.
...
... ax1.spy(x, markersize=5)
... ax2.spy(x, precision=0.1, markersize=5)
...
... ax3.spy(x)
... ax4.spy(x, precision=0.1)
...
... plt.show()
...
... #############################################################################
... #
... # .. admonition:: References
... #
... # The use of the following functions, methods, classes and modules is shown
... # in this example:
... #
... # - `matplotlib.axes.Axes.spy` / `matplotlib.pyplot.spy`
...