>>> """
===================
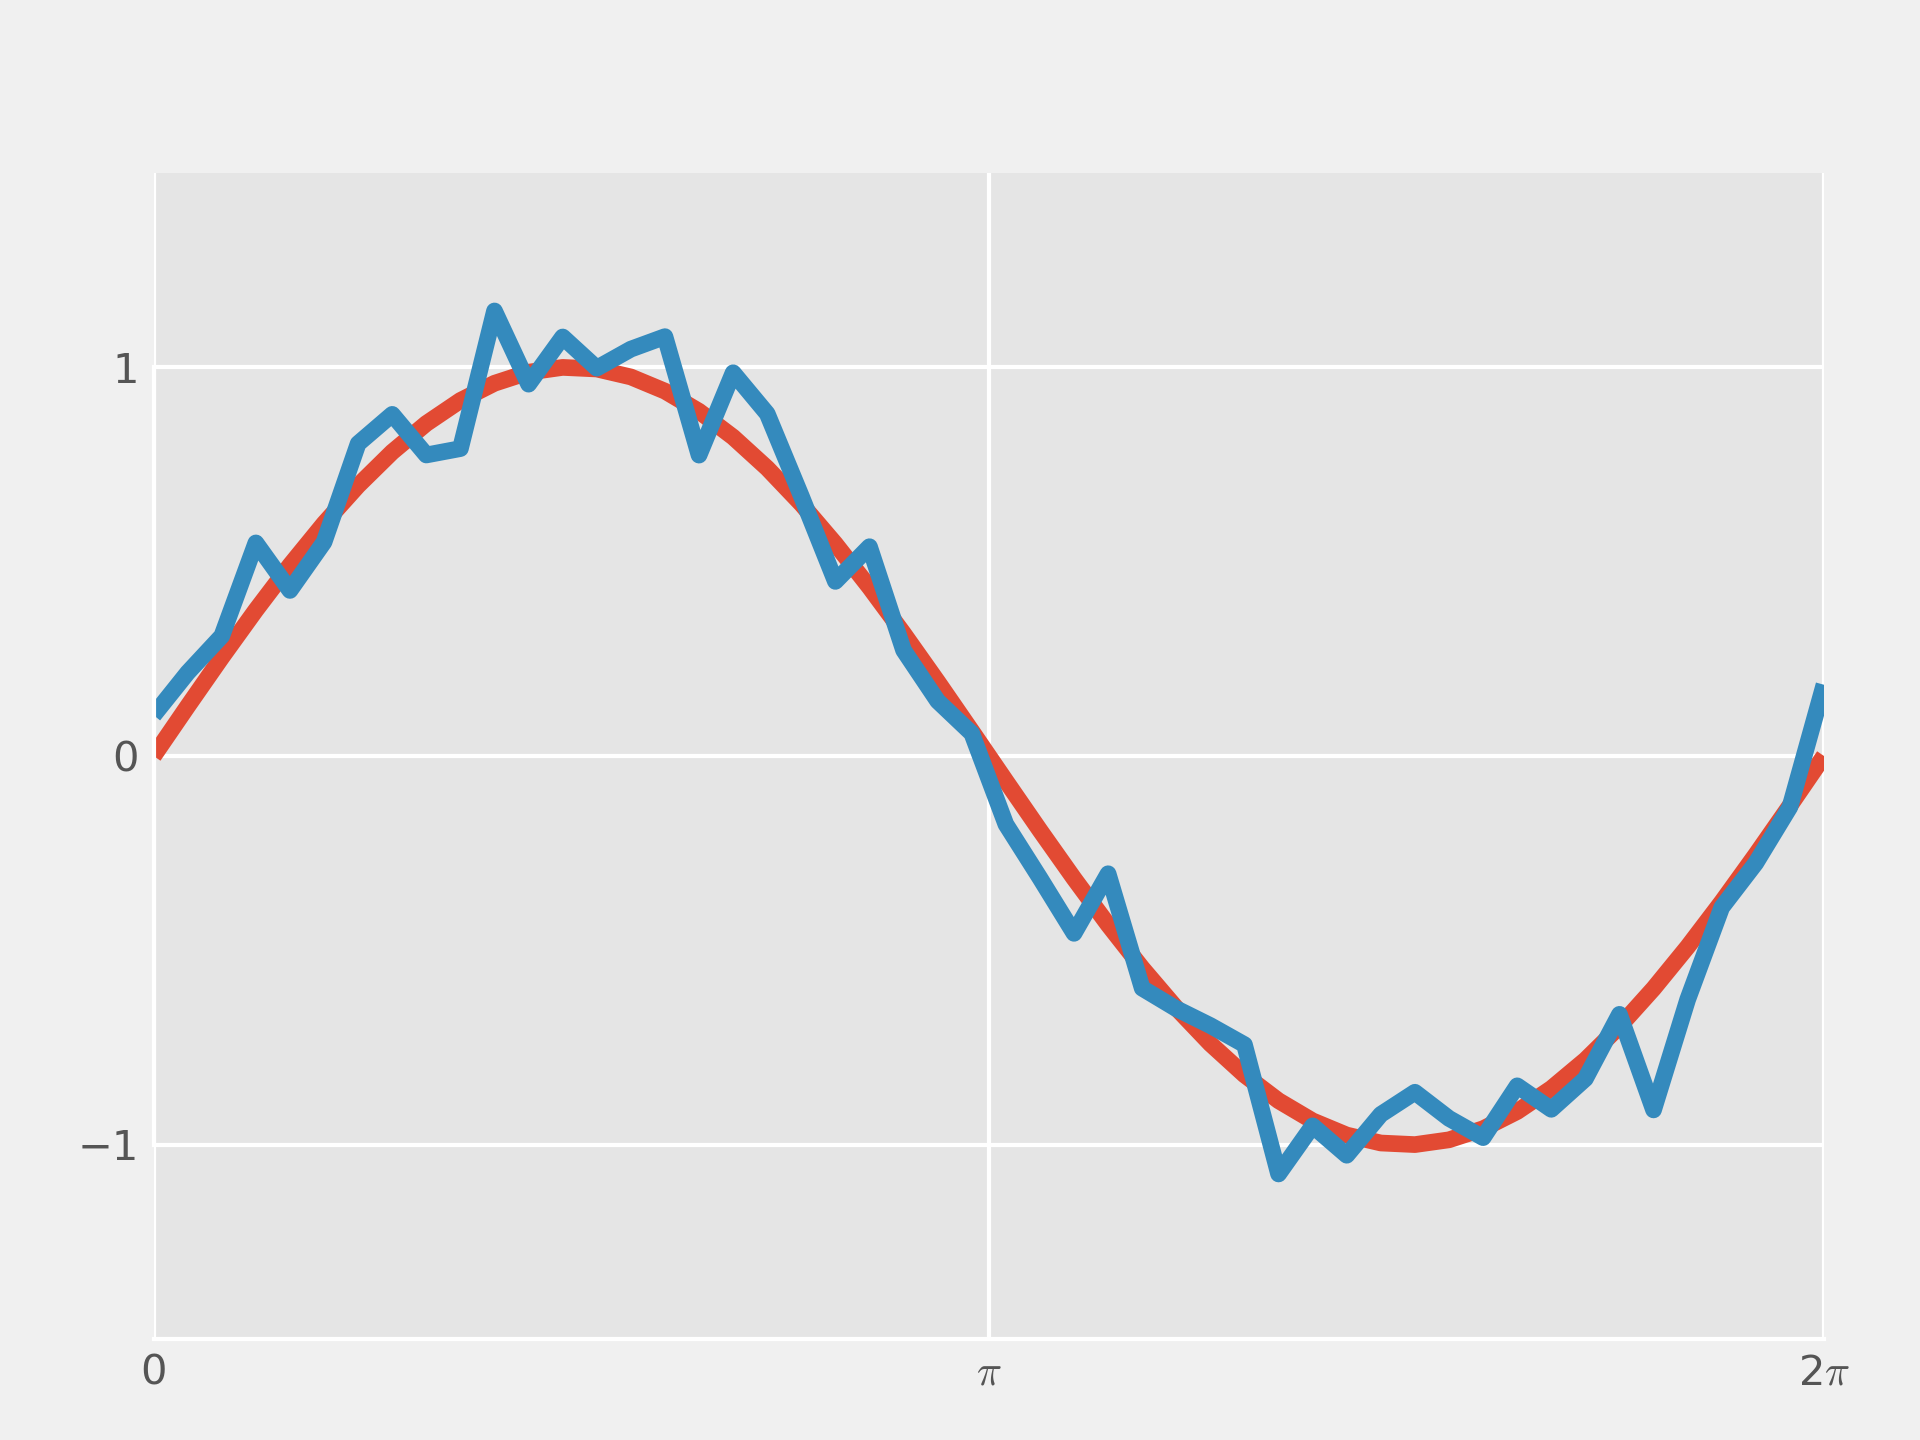
Custom spine bounds
===================
Demo of spines using custom bounds to limit the extent of the spine.
"""
... import numpy as np
... import matplotlib.pyplot as plt
...
... # Fixing random state for reproducibility
... np.random.seed(19680801)
...
... x = np.linspace(0, 2*np.pi, 50)
... y = np.sin(x)
... y2 = y + 0.1 * np.random.normal(size=x.shape)
...
... fig, ax = plt.subplots()
... ax.plot(x, y)
... ax.plot(x, y2)
...
... # set ticks and tick labels
... ax.set_xlim((0, 2*np.pi))
... ax.set_xticks([0, np.pi, 2*np.pi], labels=['0', r'$\pi$', r'2$\pi$'])
... ax.set_ylim((-1.5, 1.5))
... ax.set_yticks([-1, 0, 1])
...
... # Only draw spine between the y-ticks
... ax.spines.left.set_bounds((-1, 1))
... # Hide the right and top spines
... ax.spines.right.set_visible(False)
... ax.spines.top.set_visible(False)
... # Only show ticks on the left and bottom spines
... ax.yaxis.set_ticks_position('left')
... ax.xaxis.set_ticks_position('bottom')
...
... plt.show()
...