>>> """
===============
Spine Placement
===============
Adjusting the location and appearance of axis spines.
Note: If you want to obtain arrow heads at the ends of the axes, also check
out the :doc:`/gallery/spines/centered_spines_with_arrows` example.
"""
... import numpy as np
... import matplotlib.pyplot as plt
...
...
... ###############################################################################
...
... fig = plt.figure()
... x = np.linspace(-np.pi, np.pi, 100)
... y = 2 * np.sin(x)
...
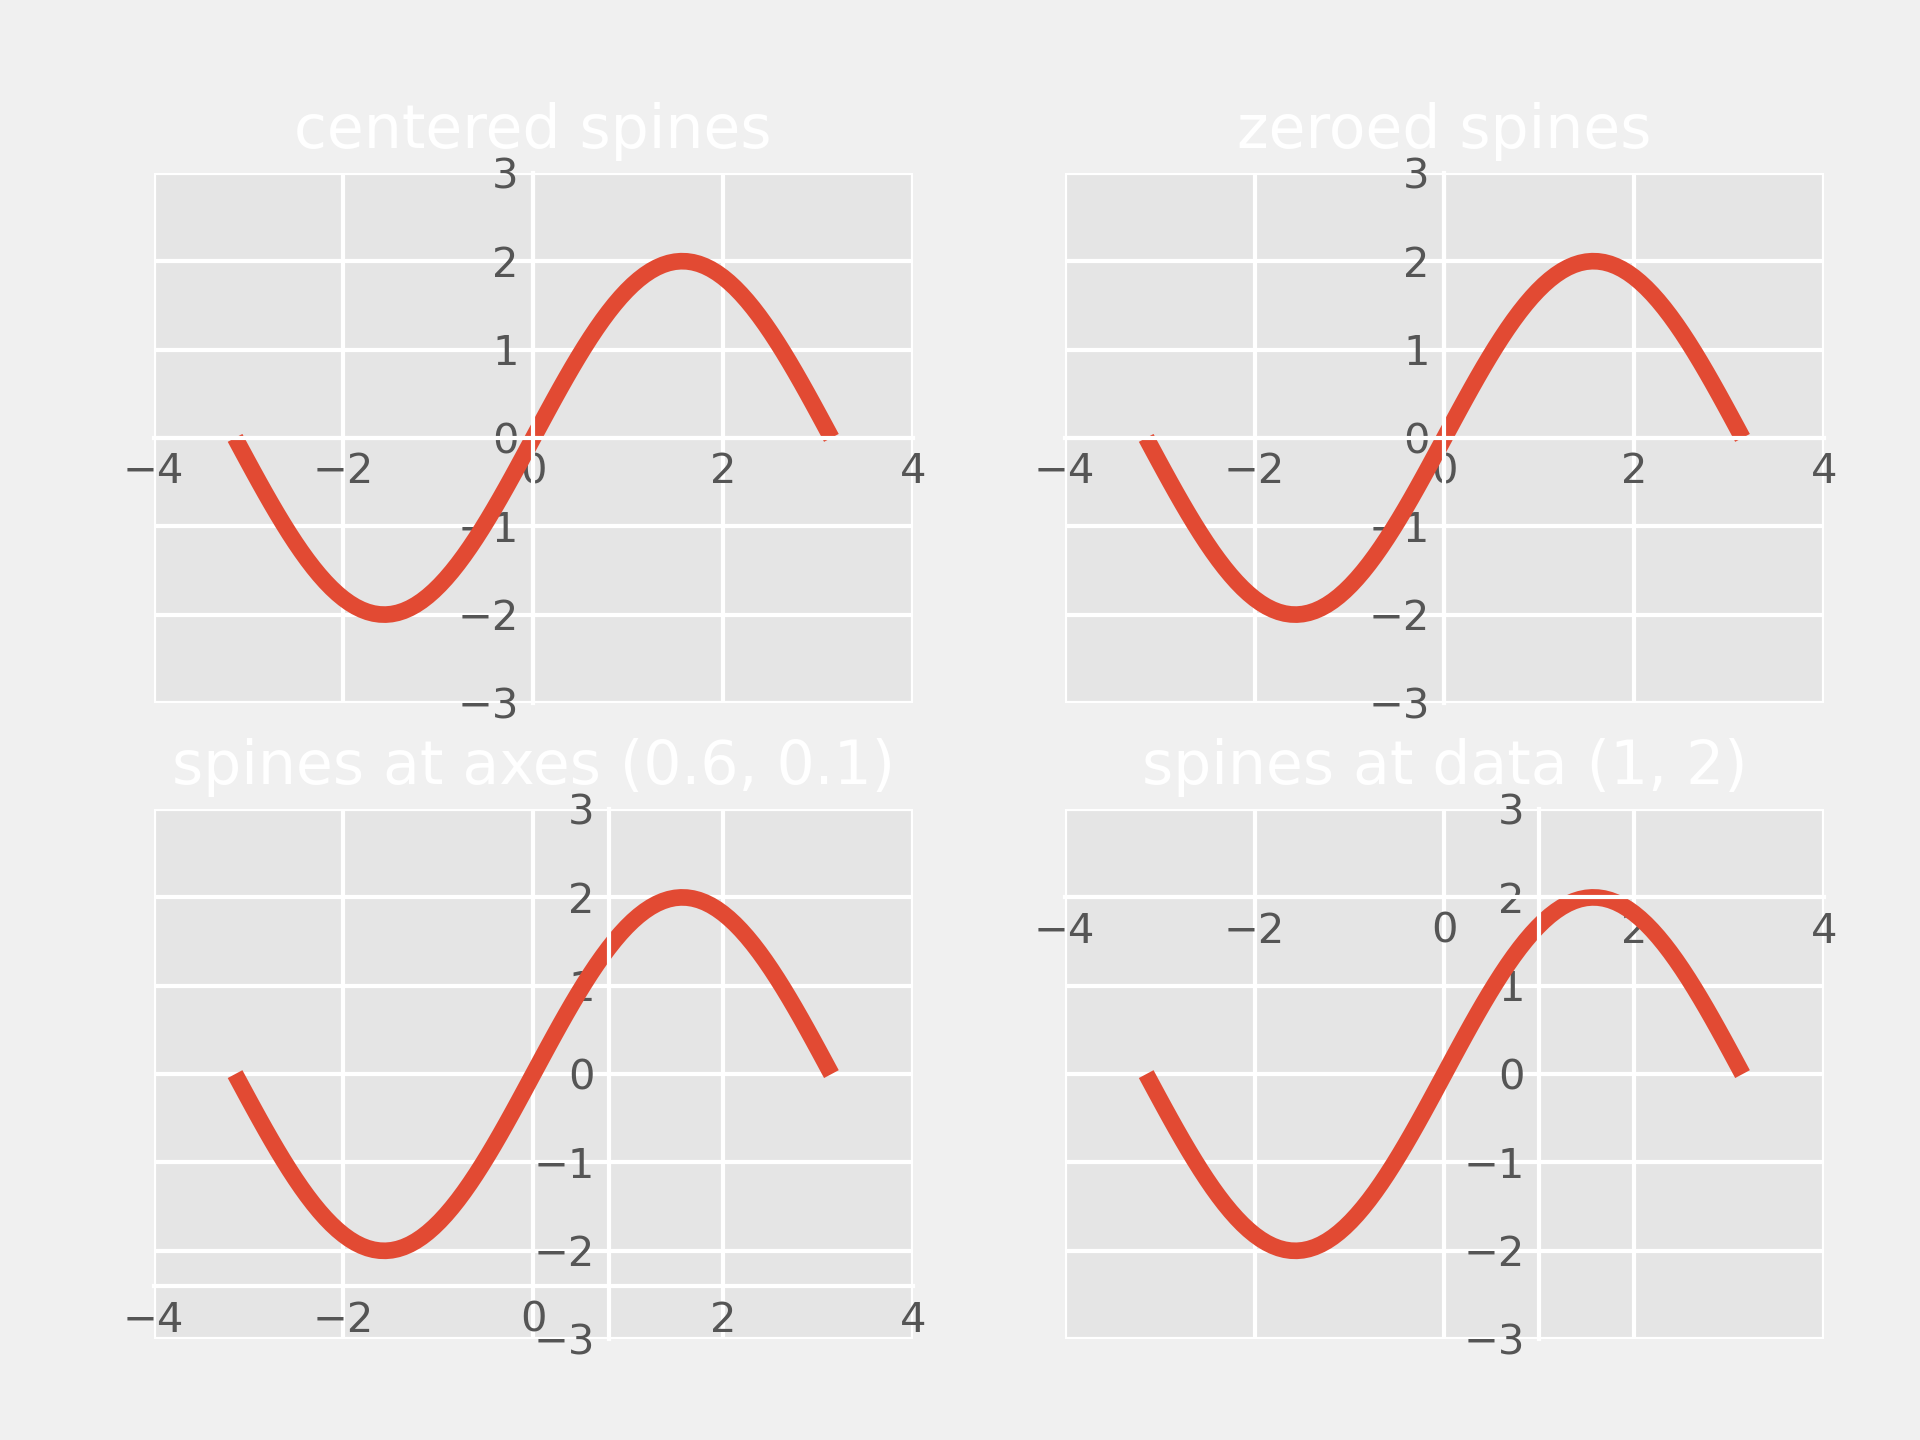
... ax = fig.add_subplot(2, 2, 1)
... ax.set_title('centered spines')
... ax.plot(x, y)
... ax.spines.left.set_position('center')
... ax.spines.right.set_color('none')
... ax.spines.bottom.set_position('center')
... ax.spines.top.set_color('none')
... ax.xaxis.set_ticks_position('bottom')
... ax.yaxis.set_ticks_position('left')
...
... ax = fig.add_subplot(2, 2, 2)
... ax.set_title('zeroed spines')
... ax.plot(x, y)
... ax.spines.left.set_position('zero')
... ax.spines.right.set_color('none')
... ax.spines.bottom.set_position('zero')
... ax.spines.top.set_color('none')
... ax.xaxis.set_ticks_position('bottom')
... ax.yaxis.set_ticks_position('left')
...
... ax = fig.add_subplot(2, 2, 3)
... ax.set_title('spines at axes (0.6, 0.1)')
... ax.plot(x, y)
... ax.spines.left.set_position(('axes', 0.6))
... ax.spines.right.set_color('none')
... ax.spines.bottom.set_position(('axes', 0.1))
... ax.spines.top.set_color('none')
... ax.xaxis.set_ticks_position('bottom')
... ax.yaxis.set_ticks_position('left')
...
... ax = fig.add_subplot(2, 2, 4)
... ax.set_title('spines at data (1, 2)')
... ax.plot(x, y)
... ax.spines.left.set_position(('data', 1))
... ax.spines.right.set_color('none')
... ax.spines.bottom.set_position(('data', 2))
... ax.spines.top.set_color('none')
... ax.xaxis.set_ticks_position('bottom')
... ax.yaxis.set_ticks_position('left')
...
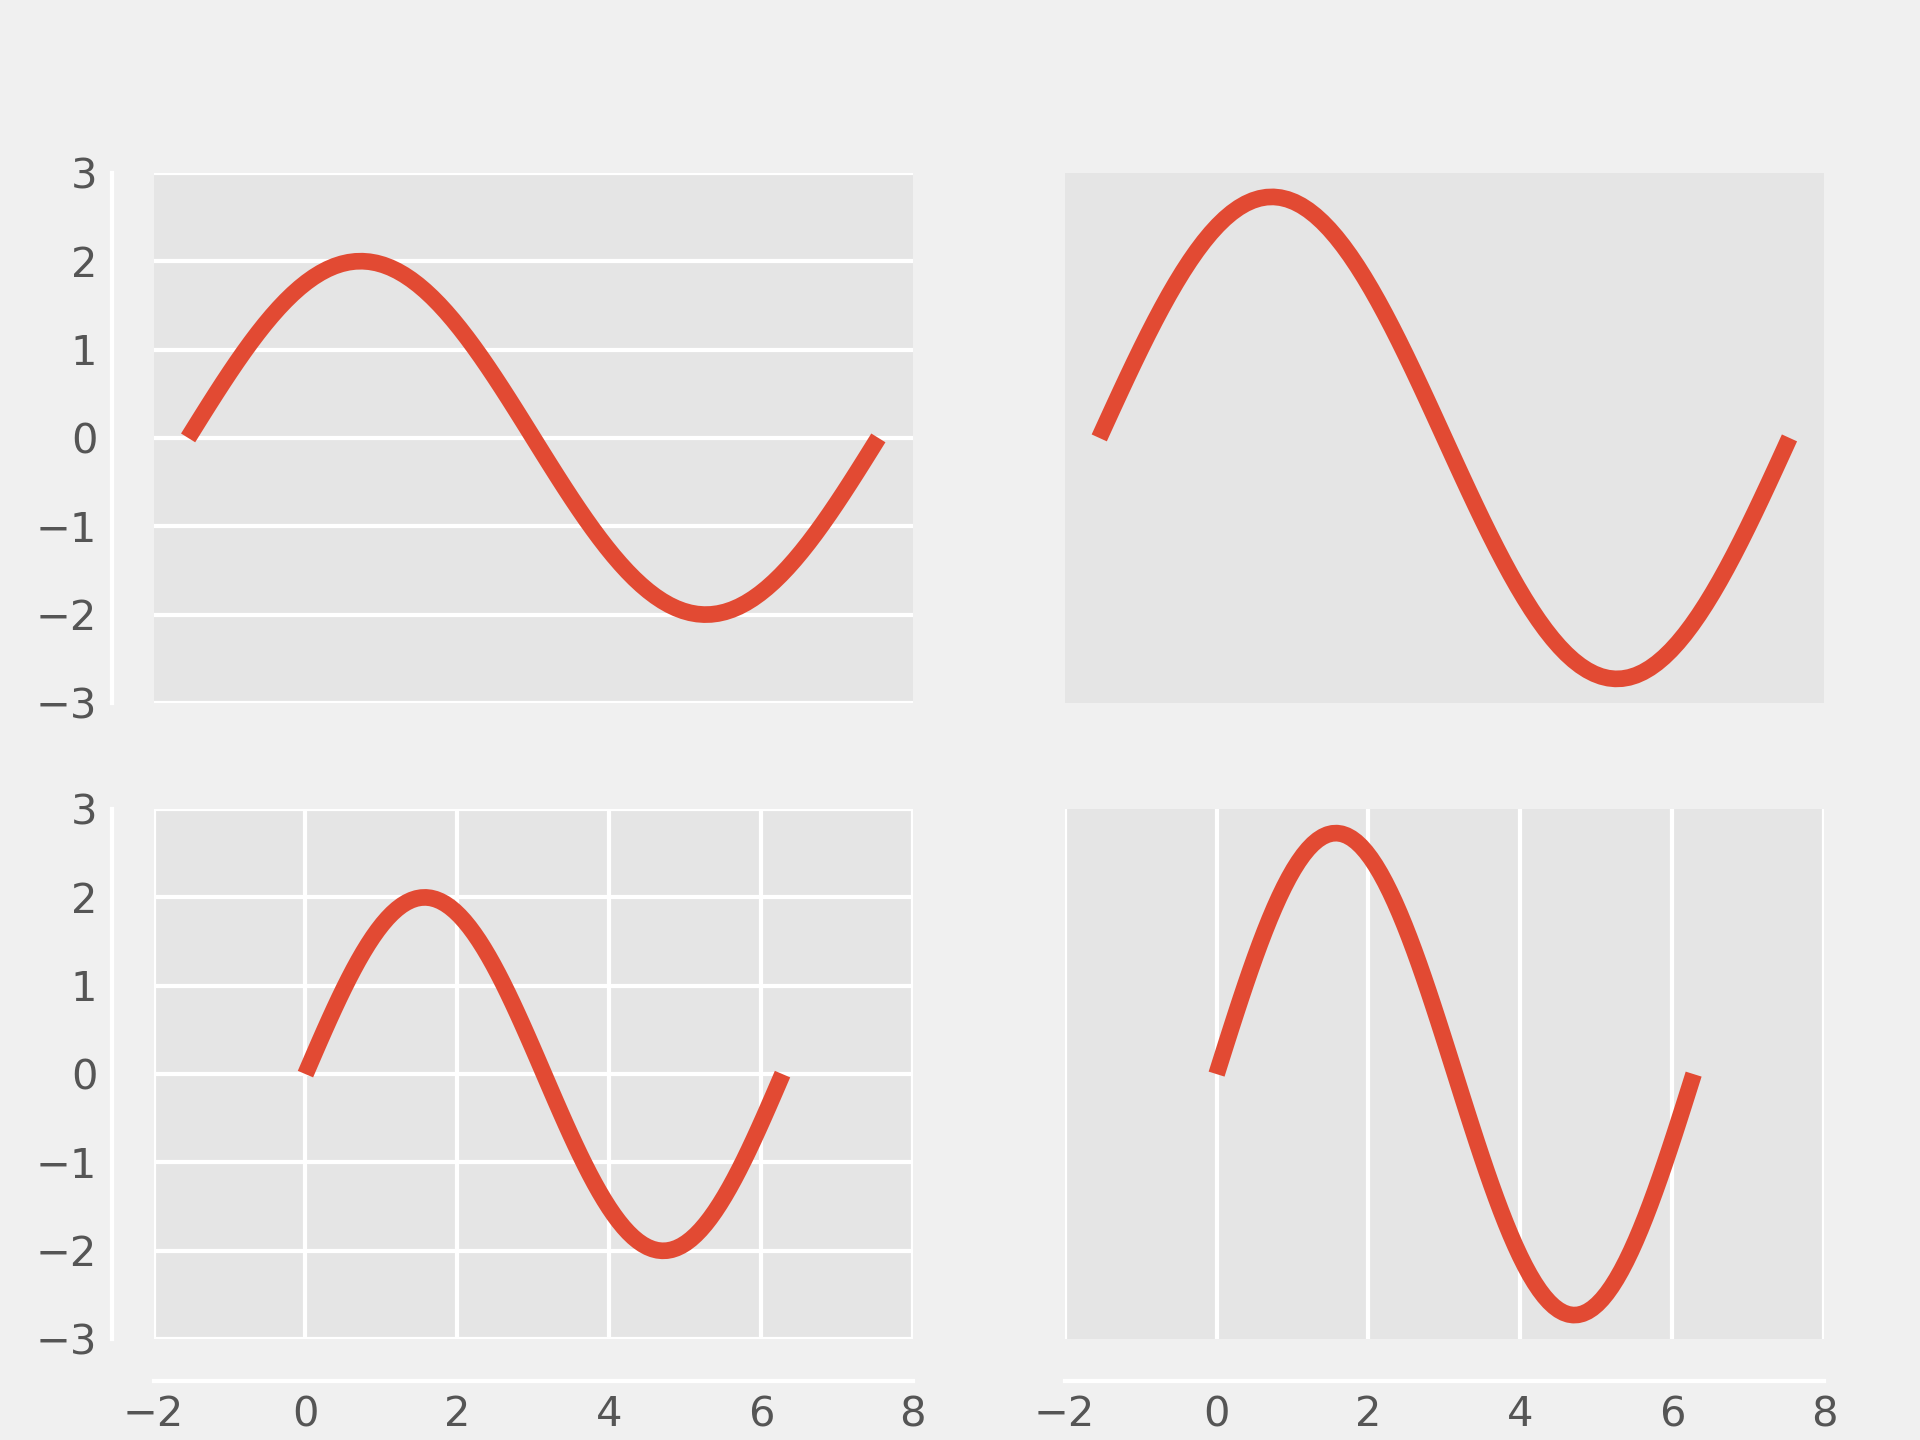
... ###############################################################################
... # Define a method that adjusts the location of the axis spines
...
...
... def adjust_spines(ax, spines):
... for loc, spine in ax.spines.items():
... if loc in spines:
... spine.set_position(('outward', 10)) # outward by 10 points
... else:
... spine.set_color('none') # don't draw spine
...
... # turn off ticks where there is no spine
... if 'left' in spines:
... ax.yaxis.set_ticks_position('left')
... else:
... # no yaxis ticks
... ax.yaxis.set_ticks([])
...
... if 'bottom' in spines:
... ax.xaxis.set_ticks_position('bottom')
... else:
... # no xaxis ticks
... ax.xaxis.set_ticks([])
...
...
... ###############################################################################
... # Create another figure using our new ``adjust_spines`` method
...
... fig = plt.figure()
...
... x = np.linspace(0, 2 * np.pi, 100)
... y = 2 * np.sin(x)
...
... ax = fig.add_subplot(2, 2, 1)
... ax.plot(x, y, clip_on=False)
... adjust_spines(ax, ['left'])
...
... ax = fig.add_subplot(2, 2, 2)
... ax.plot(x, y, clip_on=False)
... adjust_spines(ax, [])
...
... ax = fig.add_subplot(2, 2, 3)
... ax.plot(x, y, clip_on=False)
... adjust_spines(ax, ['left', 'bottom'])
...
... ax = fig.add_subplot(2, 2, 4)
... ax.plot(x, y, clip_on=False)
... adjust_spines(ax, ['bottom'])
...
... plt.show()
...