>>> """
===================================
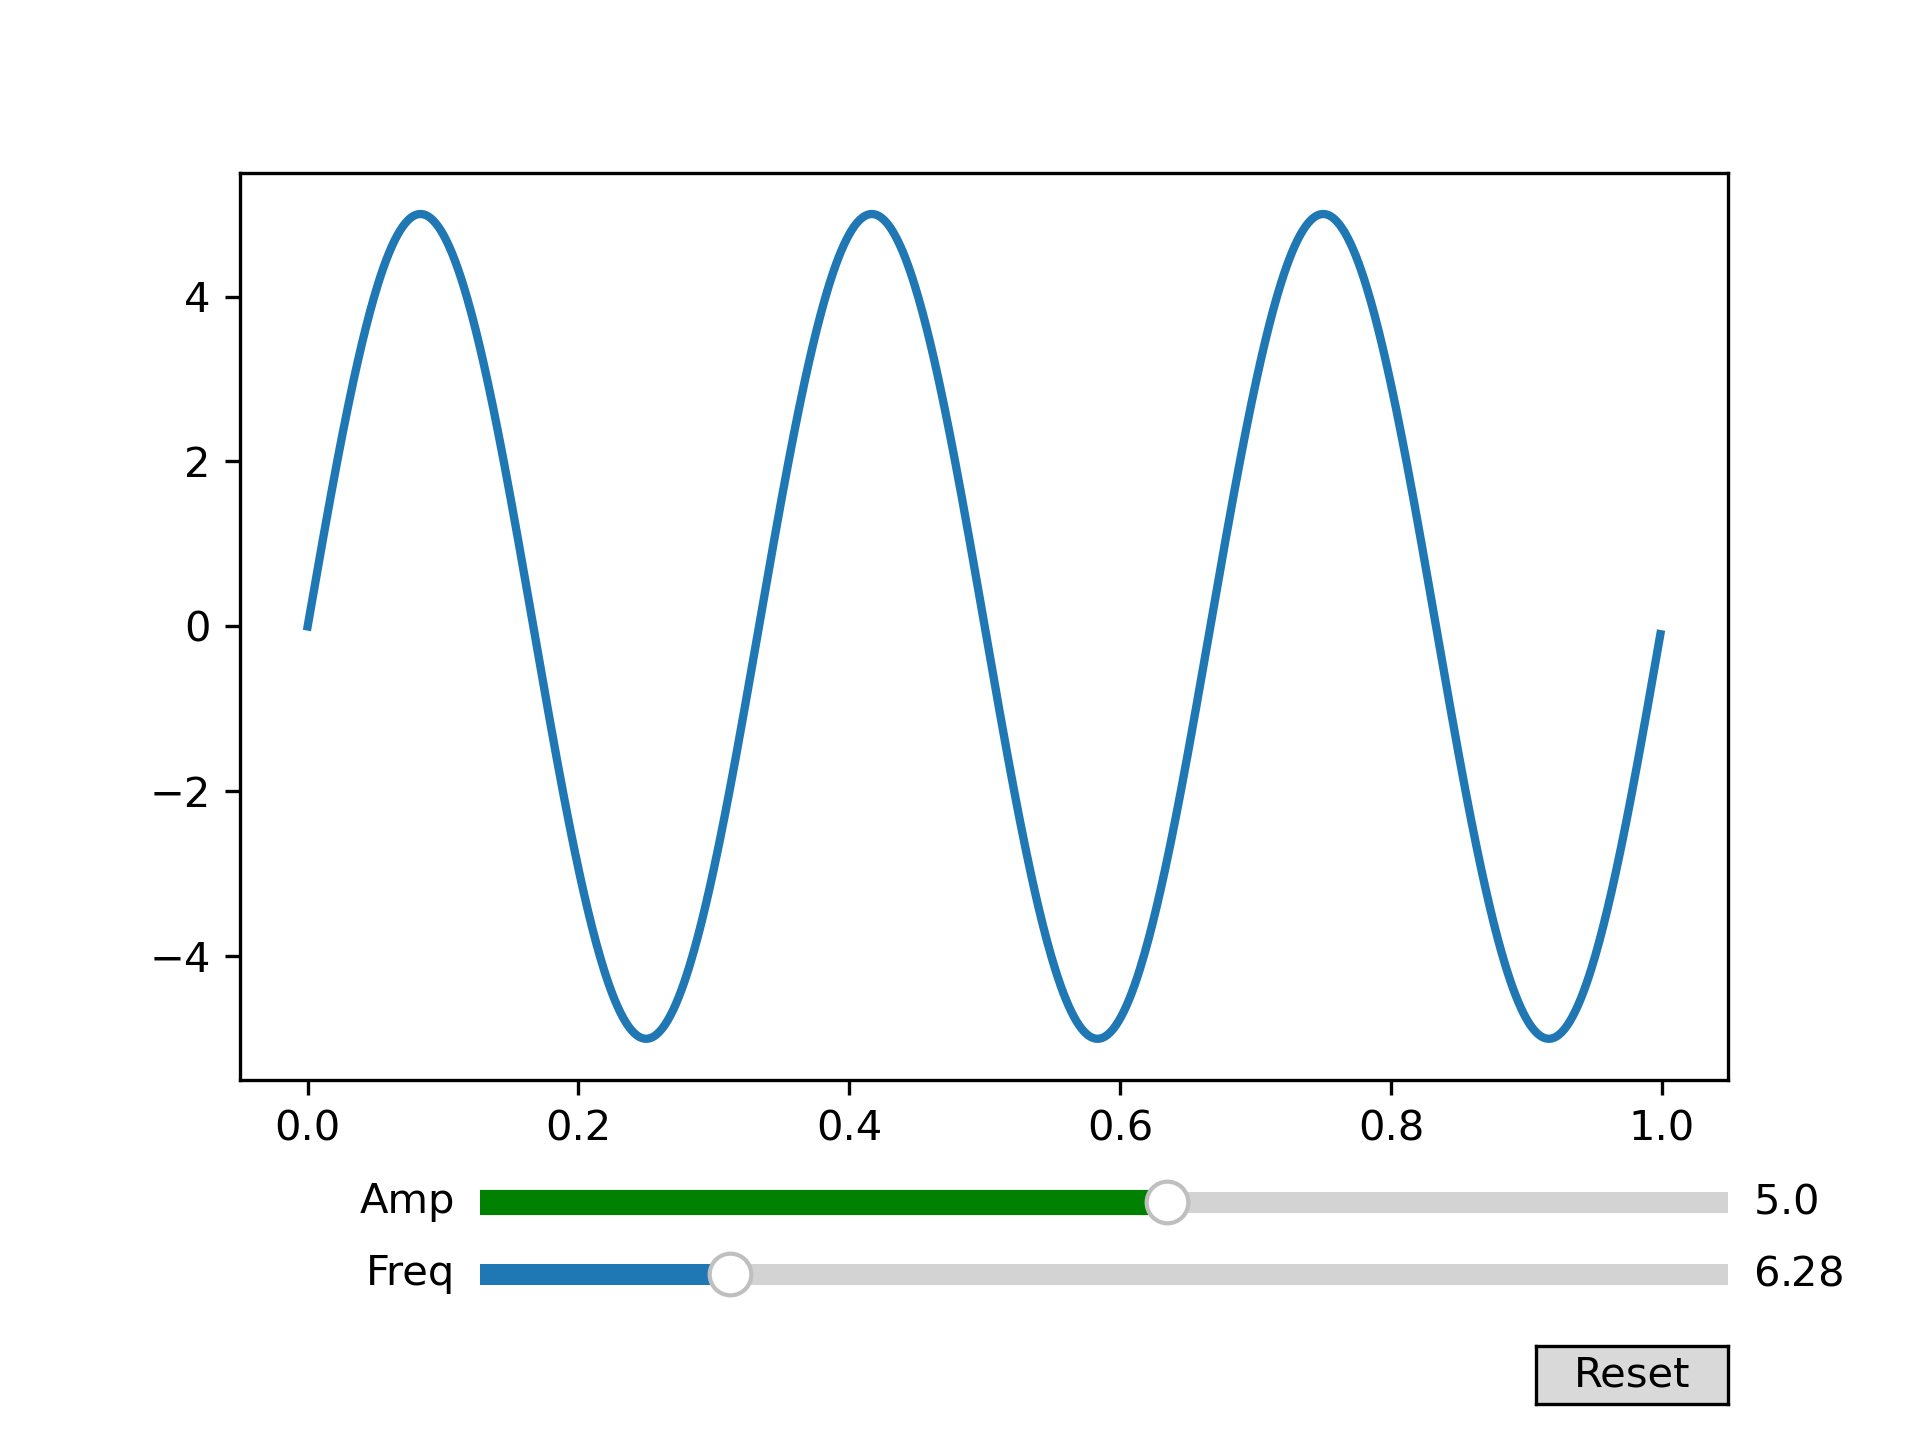
Snapping Sliders to Discrete Values
===================================
You can snap slider values to discrete values using the ``valstep`` argument.
In this example the Freq slider is constrained to be multiples of pi, and the
Amp slider uses an array as the ``valstep`` argument to more densely sample
the first part of its range.
See :doc:`/gallery/widgets/slider_demo` for an example of using
a ``Slider`` to control a single float.
See :doc:`/gallery/widgets/range_slider` for an example of using
a ``RangeSlider`` to define a range of values.
"""
... import numpy as np
... import matplotlib.pyplot as plt
... from matplotlib.widgets import Slider, Button
...
... t = np.arange(0.0, 1.0, 0.001)
... a0 = 5
... f0 = 3
... s = a0 * np.sin(2 * np.pi * f0 * t)
...
... fig, ax = plt.subplots()
... plt.subplots_adjust(bottom=0.25)
... l, = plt.plot(t, s, lw=2)
...
... ax_freq = plt.axes([0.25, 0.1, 0.65, 0.03])
... ax_amp = plt.axes([0.25, 0.15, 0.65, 0.03])
...
... # define the values to use for snapping
... allowed_amplitudes = np.concatenate([np.linspace(.1, 5, 100), [6, 7, 8, 9]])
...
... # create the sliders
... samp = Slider(
... ax_amp, "Amp", 0.1, 9.0,
... valinit=a0, valstep=allowed_amplitudes,
... color="green"
... )
...
... sfreq = Slider(
... ax_freq, "Freq", 0, 10*np.pi,
... valinit=2*np.pi, valstep=np.pi,
... initcolor='none' # Remove the line marking the valinit position.
... )
...
...
... def update(val):
... amp = samp.val
... freq = sfreq.val
... l.set_ydata(amp*np.sin(2*np.pi*freq*t))
... fig.canvas.draw_idle()
...
...
... sfreq.on_changed(update)
... samp.on_changed(update)
...
... ax_reset = plt.axes([0.8, 0.025, 0.1, 0.04])
... button = Button(ax_reset, 'Reset', hovercolor='0.975')
...
...
... def reset(event):
... sfreq.reset()
... samp.reset()
... button.on_clicked(reset)
...
...
... plt.show()
...
... #############################################################################
... #
... # .. admonition:: References
... #
... # The use of the following functions, methods, classes and modules is shown
... # in this example:
... #
... # - `matplotlib.widgets.Slider`
... # - `matplotlib.widgets.Button`
...