>>> """
======
Slider
======
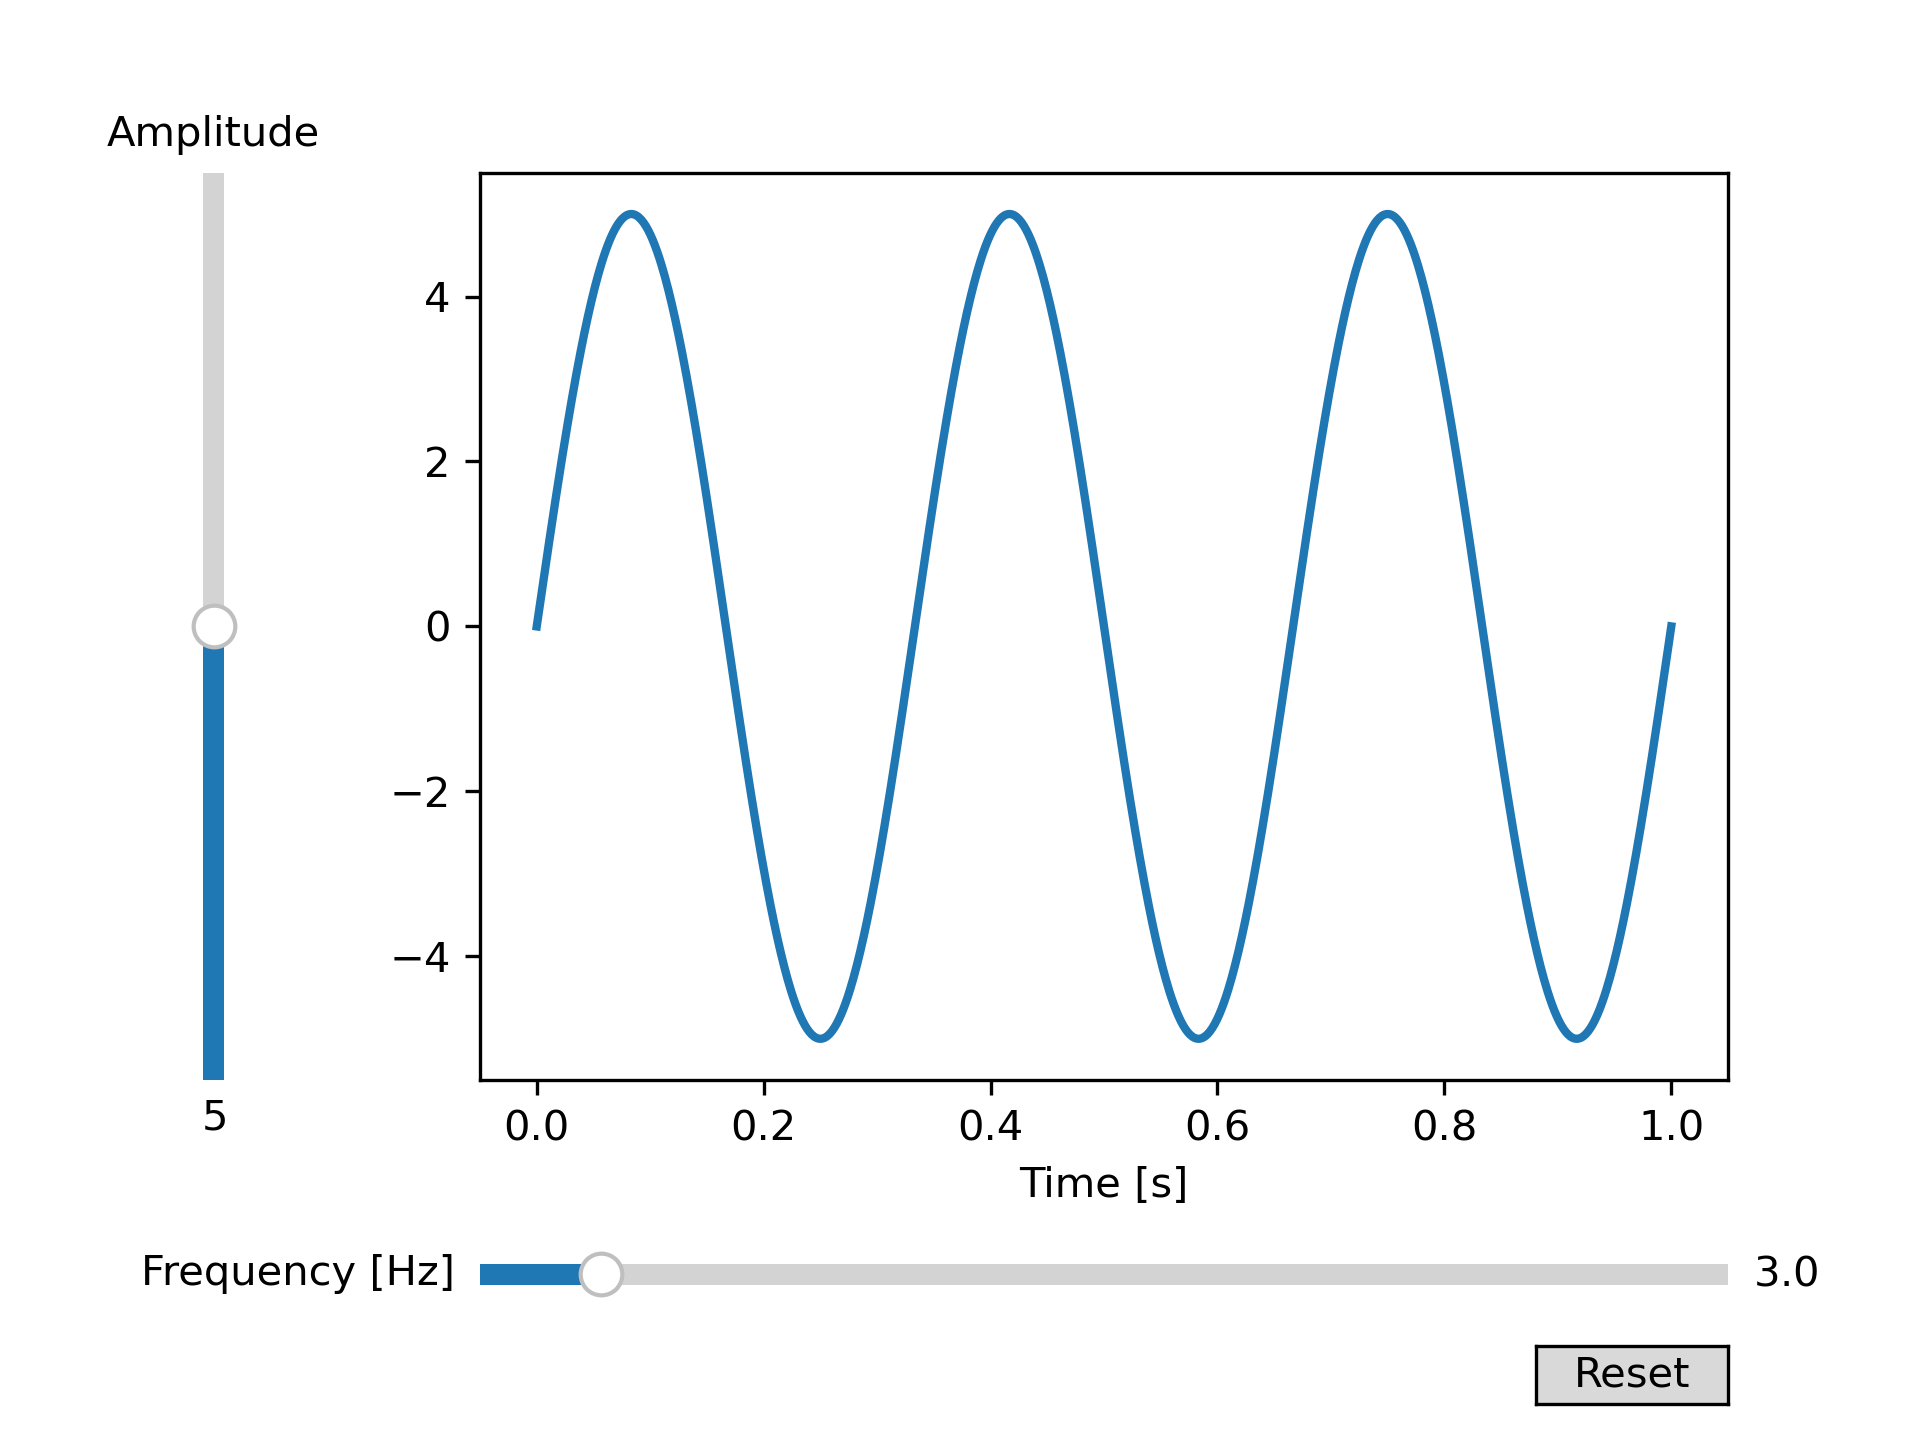
In this example, sliders are used to control the frequency and amplitude of
a sine wave.
See :doc:`/gallery/widgets/slider_snap_demo` for an example of having
the ``Slider`` snap to discrete values.
See :doc:`/gallery/widgets/range_slider` for an example of using
a ``RangeSlider`` to define a range of values.
"""
... import numpy as np
... import matplotlib.pyplot as plt
... from matplotlib.widgets import Slider, Button
...
...
... # The parametrized function to be plotted
... def f(t, amplitude, frequency):
... return amplitude * np.sin(2 * np.pi * frequency * t)
...
... t = np.linspace(0, 1, 1000)
...
... # Define initial parameters
... init_amplitude = 5
... init_frequency = 3
...
... # Create the figure and the line that we will manipulate
... fig, ax = plt.subplots()
... line, = plt.plot(t, f(t, init_amplitude, init_frequency), lw=2)
... ax.set_xlabel('Time [s]')
...
... # adjust the main plot to make room for the sliders
... plt.subplots_adjust(left=0.25, bottom=0.25)
...
... # Make a horizontal slider to control the frequency.
... axfreq = plt.axes([0.25, 0.1, 0.65, 0.03])
... freq_slider = Slider(
... ax=axfreq,
... label='Frequency [Hz]',
... valmin=0.1,
... valmax=30,
... valinit=init_frequency,
... )
...
... # Make a vertically oriented slider to control the amplitude
... axamp = plt.axes([0.1, 0.25, 0.0225, 0.63])
... amp_slider = Slider(
... ax=axamp,
... label="Amplitude",
... valmin=0,
... valmax=10,
... valinit=init_amplitude,
... orientation="vertical"
... )
...
...
... # The function to be called anytime a slider's value changes
... def update(val):
... line.set_ydata(f(t, amp_slider.val, freq_slider.val))
... fig.canvas.draw_idle()
...
...
... # register the update function with each slider
... freq_slider.on_changed(update)
... amp_slider.on_changed(update)
...
... # Create a `matplotlib.widgets.Button` to reset the sliders to initial values.
... resetax = plt.axes([0.8, 0.025, 0.1, 0.04])
... button = Button(resetax, 'Reset', hovercolor='0.975')
...
...
... def reset(event):
... freq_slider.reset()
... amp_slider.reset()
... button.on_clicked(reset)
...
... plt.show()
...
... #############################################################################
... #
... # .. admonition:: References
... #
... # The use of the following functions, methods, classes and modules is shown
... # in this example:
... #
... # - `matplotlib.widgets.Button`
... # - `matplotlib.widgets.Slider`
...