>>> """
===========
Simple Plot
===========
Create a simple plot.
"""
...
... import matplotlib.pyplot as plt
... import numpy as np
...
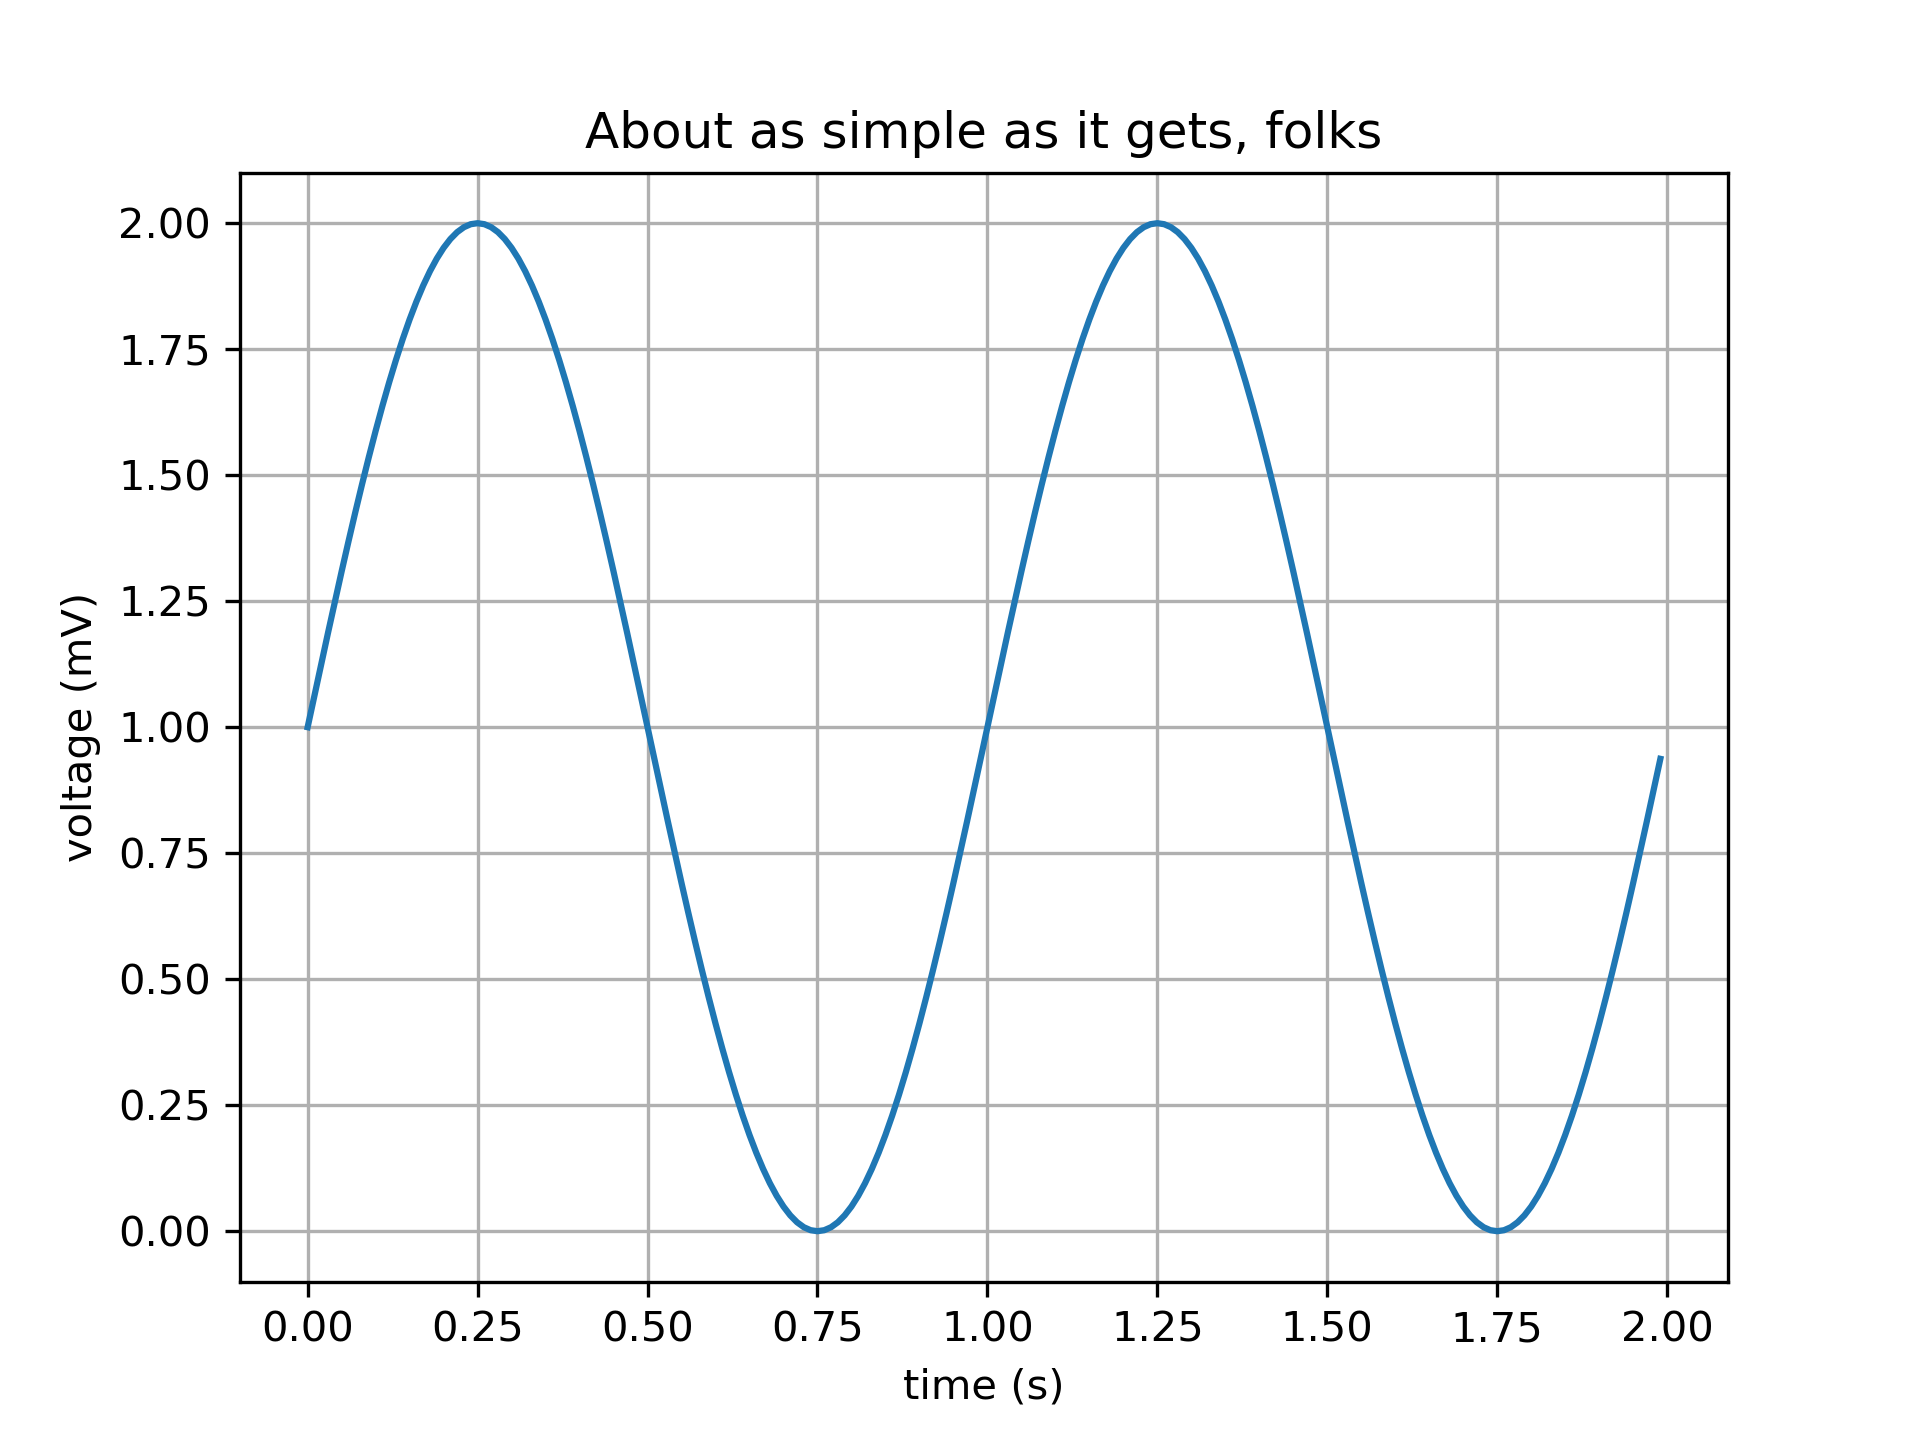
... # Data for plotting
... t = np.arange(0.0, 2.0, 0.01)
... s = 1 + np.sin(2 * np.pi * t)
...
... fig, ax = plt.subplots()
... ax.plot(t, s)
...
... ax.set(xlabel='time (s)', ylabel='voltage (mV)',
... title='About as simple as it gets, folks')
... ax.grid()
...
... fig.savefig("test.png")
... plt.show()
...
... #############################################################################
... #
... # .. admonition:: References
... #
... # The use of the following functions, methods, classes and modules is shown
... # in this example:
... #
... # - `matplotlib.axes.Axes.plot` / `matplotlib.pyplot.plot`
... # - `matplotlib.pyplot.subplots`
... # - `matplotlib.figure.Figure.savefig`
...