>>> """
================
Simple Axisline4
================
"""
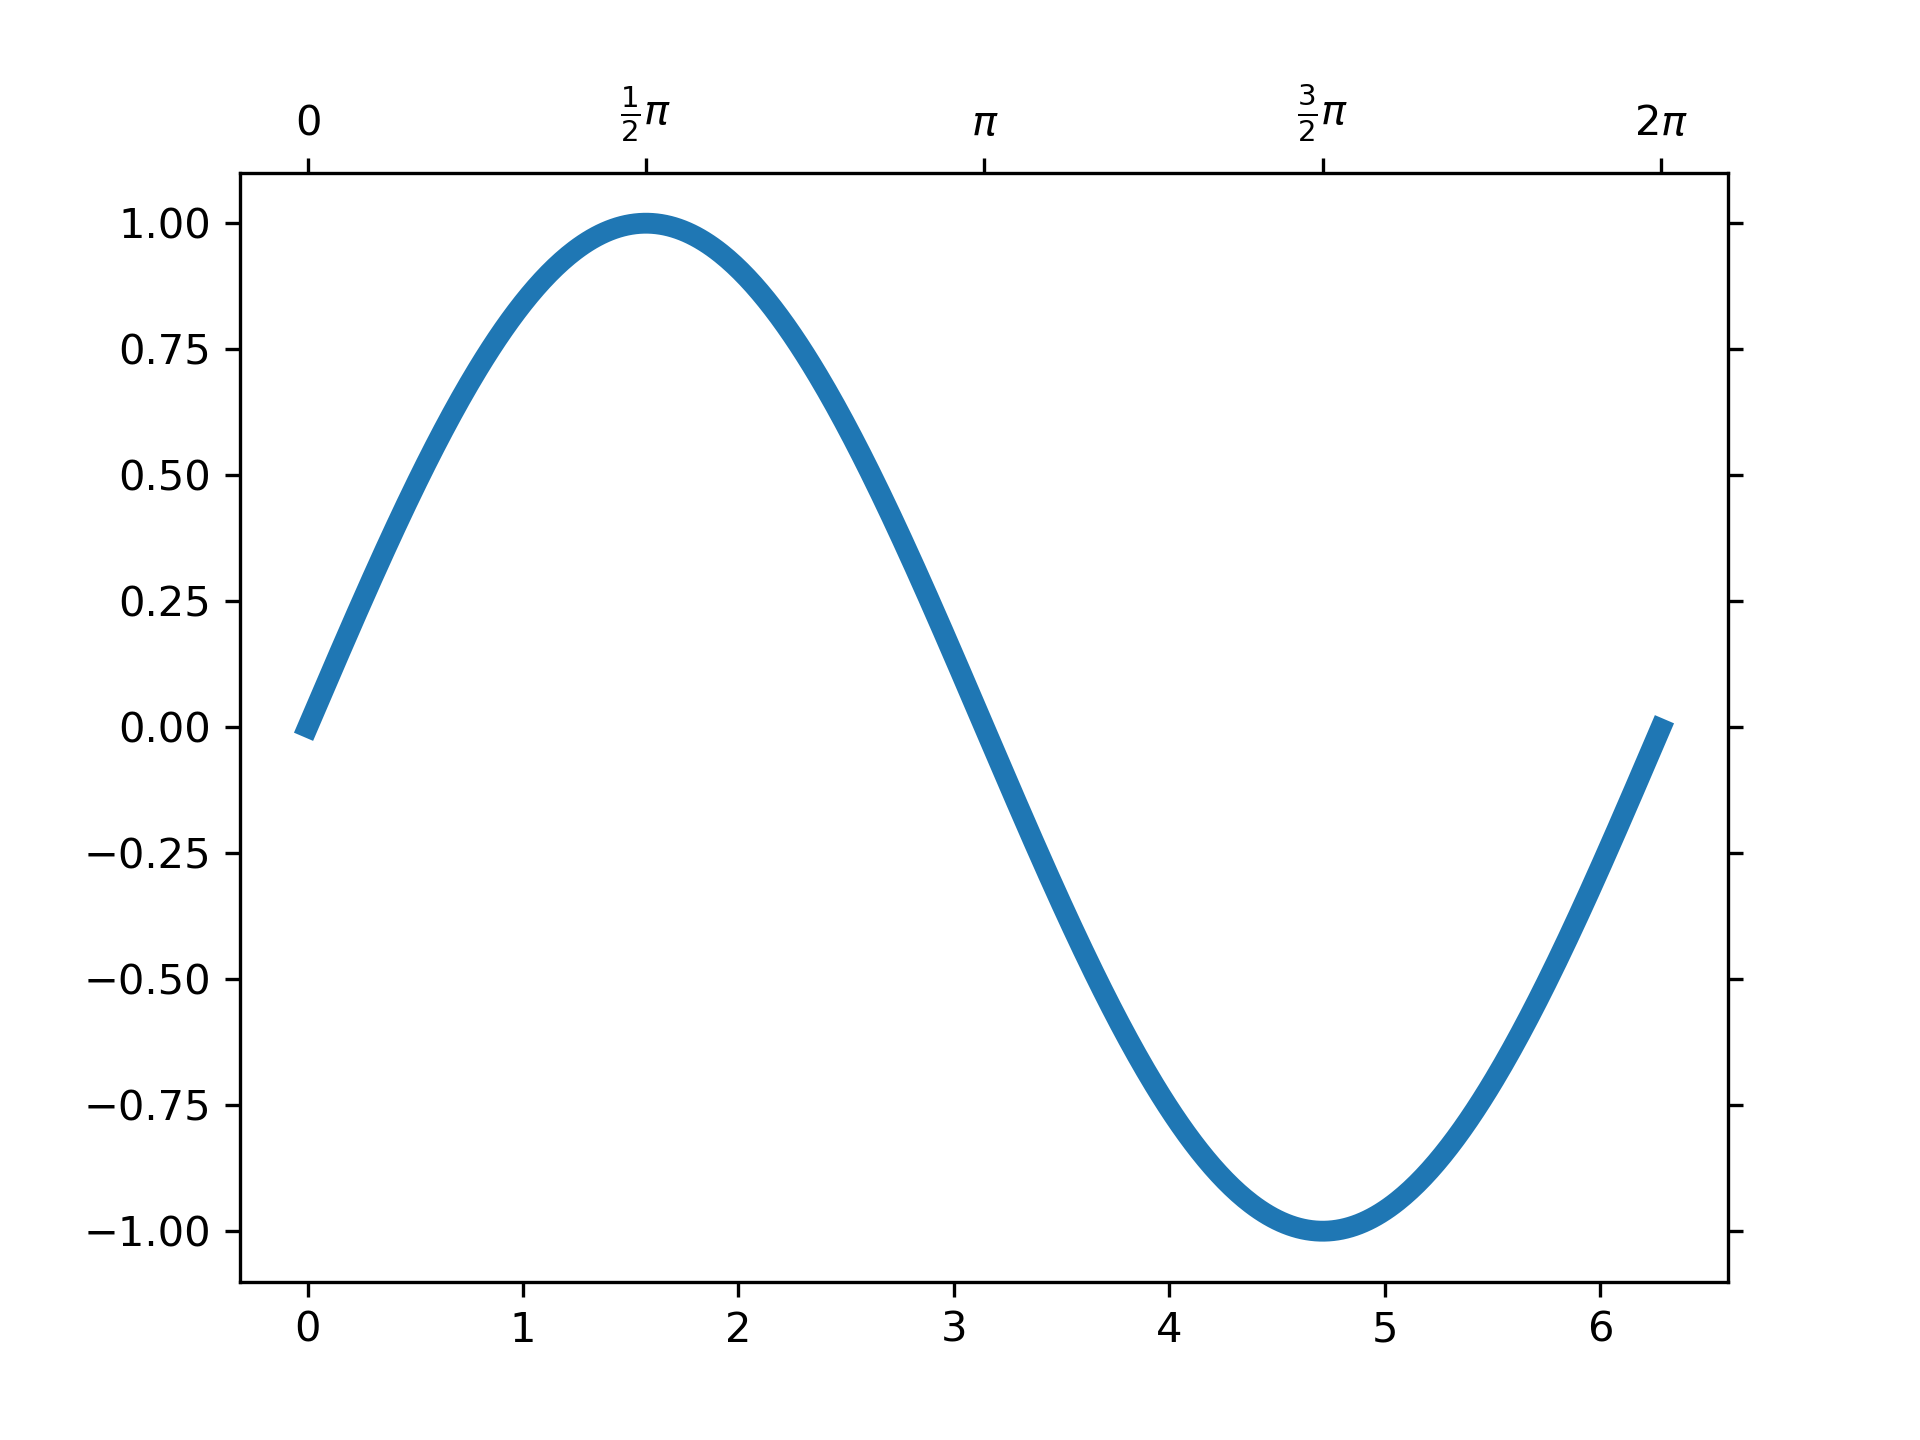
... import matplotlib.pyplot as plt
... from mpl_toolkits.axes_grid1 import host_subplot
... import numpy as np
...
... ax = host_subplot(111)
... xx = np.arange(0, 2*np.pi, 0.01)
... ax.plot(xx, np.sin(xx))
...
... ax2 = ax.twin() # ax2 is responsible for "top" axis and "right" axis
... ax2.set_xticks([0., .5*np.pi, np.pi, 1.5*np.pi, 2*np.pi],
... labels=["$0$", r"$\frac{1}{2}\pi$",
... r"$\pi$", r"$\frac{3}{2}\pi$", r"$2\pi$"])
...
... ax2.axis["right"].major_ticklabels.set_visible(False)
... ax2.axis["top"].major_ticklabels.set_visible(True)
...
... plt.show()
...