>>> """
=====================
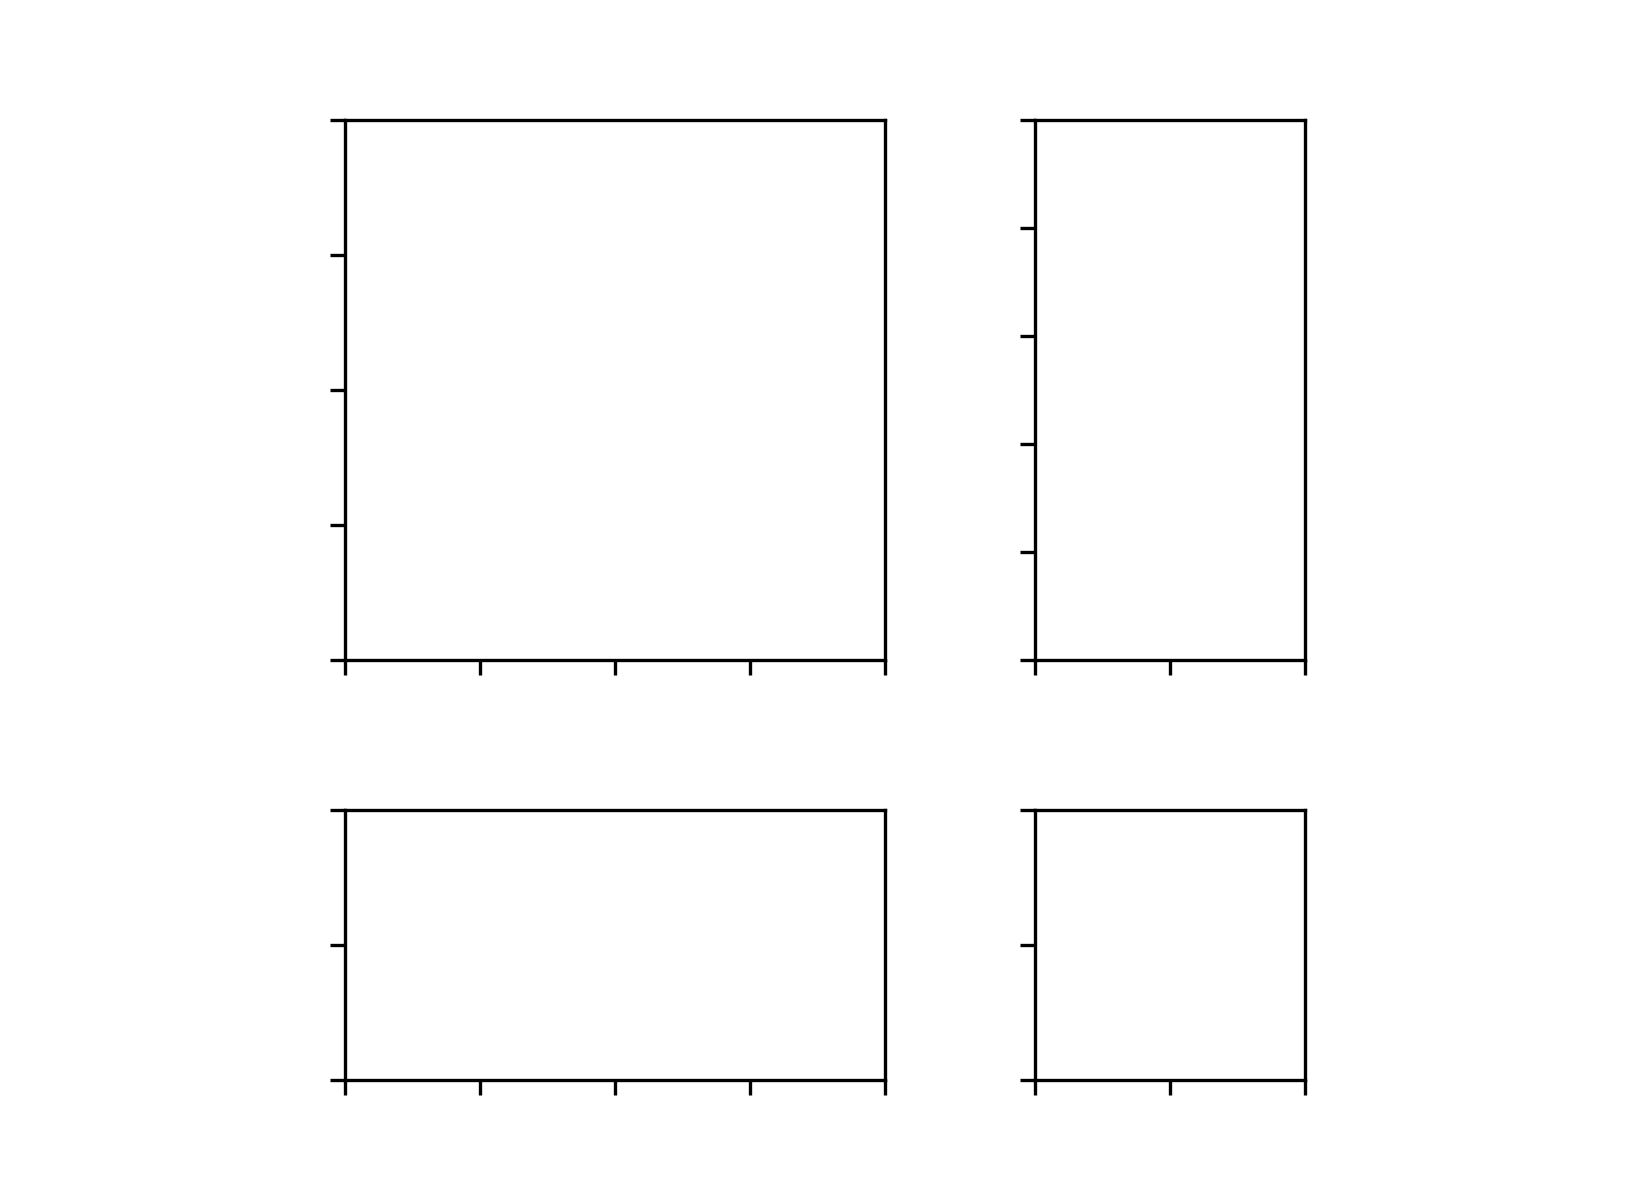
Simple Axes Divider 3
=====================
See also :doc:`/tutorials/toolkits/axes_grid`.
"""
...
... import mpl_toolkits.axes_grid1.axes_size as Size
... from mpl_toolkits.axes_grid1 import Divider
... import matplotlib.pyplot as plt
...
...
... fig = plt.figure(figsize=(5.5, 4))
...
... # the rect parameter will be ignore as we will set axes_locator
... rect = (0.1, 0.1, 0.8, 0.8)
... ax = [fig.add_axes(rect, label="%d" % i) for i in range(4)]
...
...
... horiz = [Size.AxesX(ax[0]), Size.Fixed(.5), Size.AxesX(ax[1])]
... vert = [Size.AxesY(ax[0]), Size.Fixed(.5), Size.AxesY(ax[2])]
...
... # divide the axes rectangle into grid whose size is specified by horiz * vert
... divider = Divider(fig, rect, horiz, vert, aspect=False)
...
...
... ax[0].set_axes_locator(divider.new_locator(nx=0, ny=0))
... ax[1].set_axes_locator(divider.new_locator(nx=2, ny=0))
... ax[2].set_axes_locator(divider.new_locator(nx=0, ny=2))
... ax[3].set_axes_locator(divider.new_locator(nx=2, ny=2))
...
... ax[0].set_xlim(0, 2)
... ax[1].set_xlim(0, 1)
...
... ax[0].set_ylim(0, 1)
... ax[2].set_ylim(0, 2)
...
... divider.set_aspect(1.)
...
... for ax1 in ax:
... ax1.tick_params(labelbottom=False, labelleft=False)
...
... plt.show()
...