>>> """
======================
Set and get properties
======================
The pyplot interface allows you to use ``setp`` and ``getp`` to
set and get object properties respectively, as well as to do
introspection on the object.
Setting with ``setp``
=====================
To set the linestyle of a line to be dashed, you use ``setp``::
>>> line, = plt.plot([1, 2, 3])
>>> plt.setp(line, linestyle='--')
If you want to know the valid types of arguments, you can provide the
name of the property you want to set without a value::
>>> plt.setp(line, 'linestyle')
linestyle: {'-', '--', '-.', ':', '', (offset, on-off-seq), ...}
If you want to see all the properties that can be set, and their
possible values, you can do::
>>> plt.setp(line)
``setp`` operates on a single instance or a list of instances. If you
are in query mode introspecting the possible values, only the first
instance in the sequence is used. When actually setting values, all
the instances will be set. For example, suppose you have a list of
two lines, the following will make both lines thicker and red::
>>> x = np.arange(0, 1, 0.01)
>>> y1 = np.sin(2*np.pi*x)
>>> y2 = np.sin(4*np.pi*x)
>>> lines = plt.plot(x, y1, x, y2)
>>> plt.setp(lines, linewidth=2, color='r')
Getting with ``getp``
=====================
``getp`` returns the value of a given attribute. You can use it to query
the value of a single attribute::
>>> plt.getp(line, 'linewidth')
0.5
or all the attribute/value pairs::
>>> plt.getp(line)
aa = True
alpha = 1.0
antialiased = True
c = b
clip_on = True
color = b
... long listing skipped ...
Aliases
=======
To reduce keystrokes in interactive mode, a number of properties
have short aliases, e.g., 'lw' for 'linewidth' and 'mec' for
'markeredgecolor'. When calling set or get in introspection mode,
these properties will be listed as 'fullname' or 'aliasname'.
"""
...
...
... import matplotlib.pyplot as plt
... import numpy as np
...
...
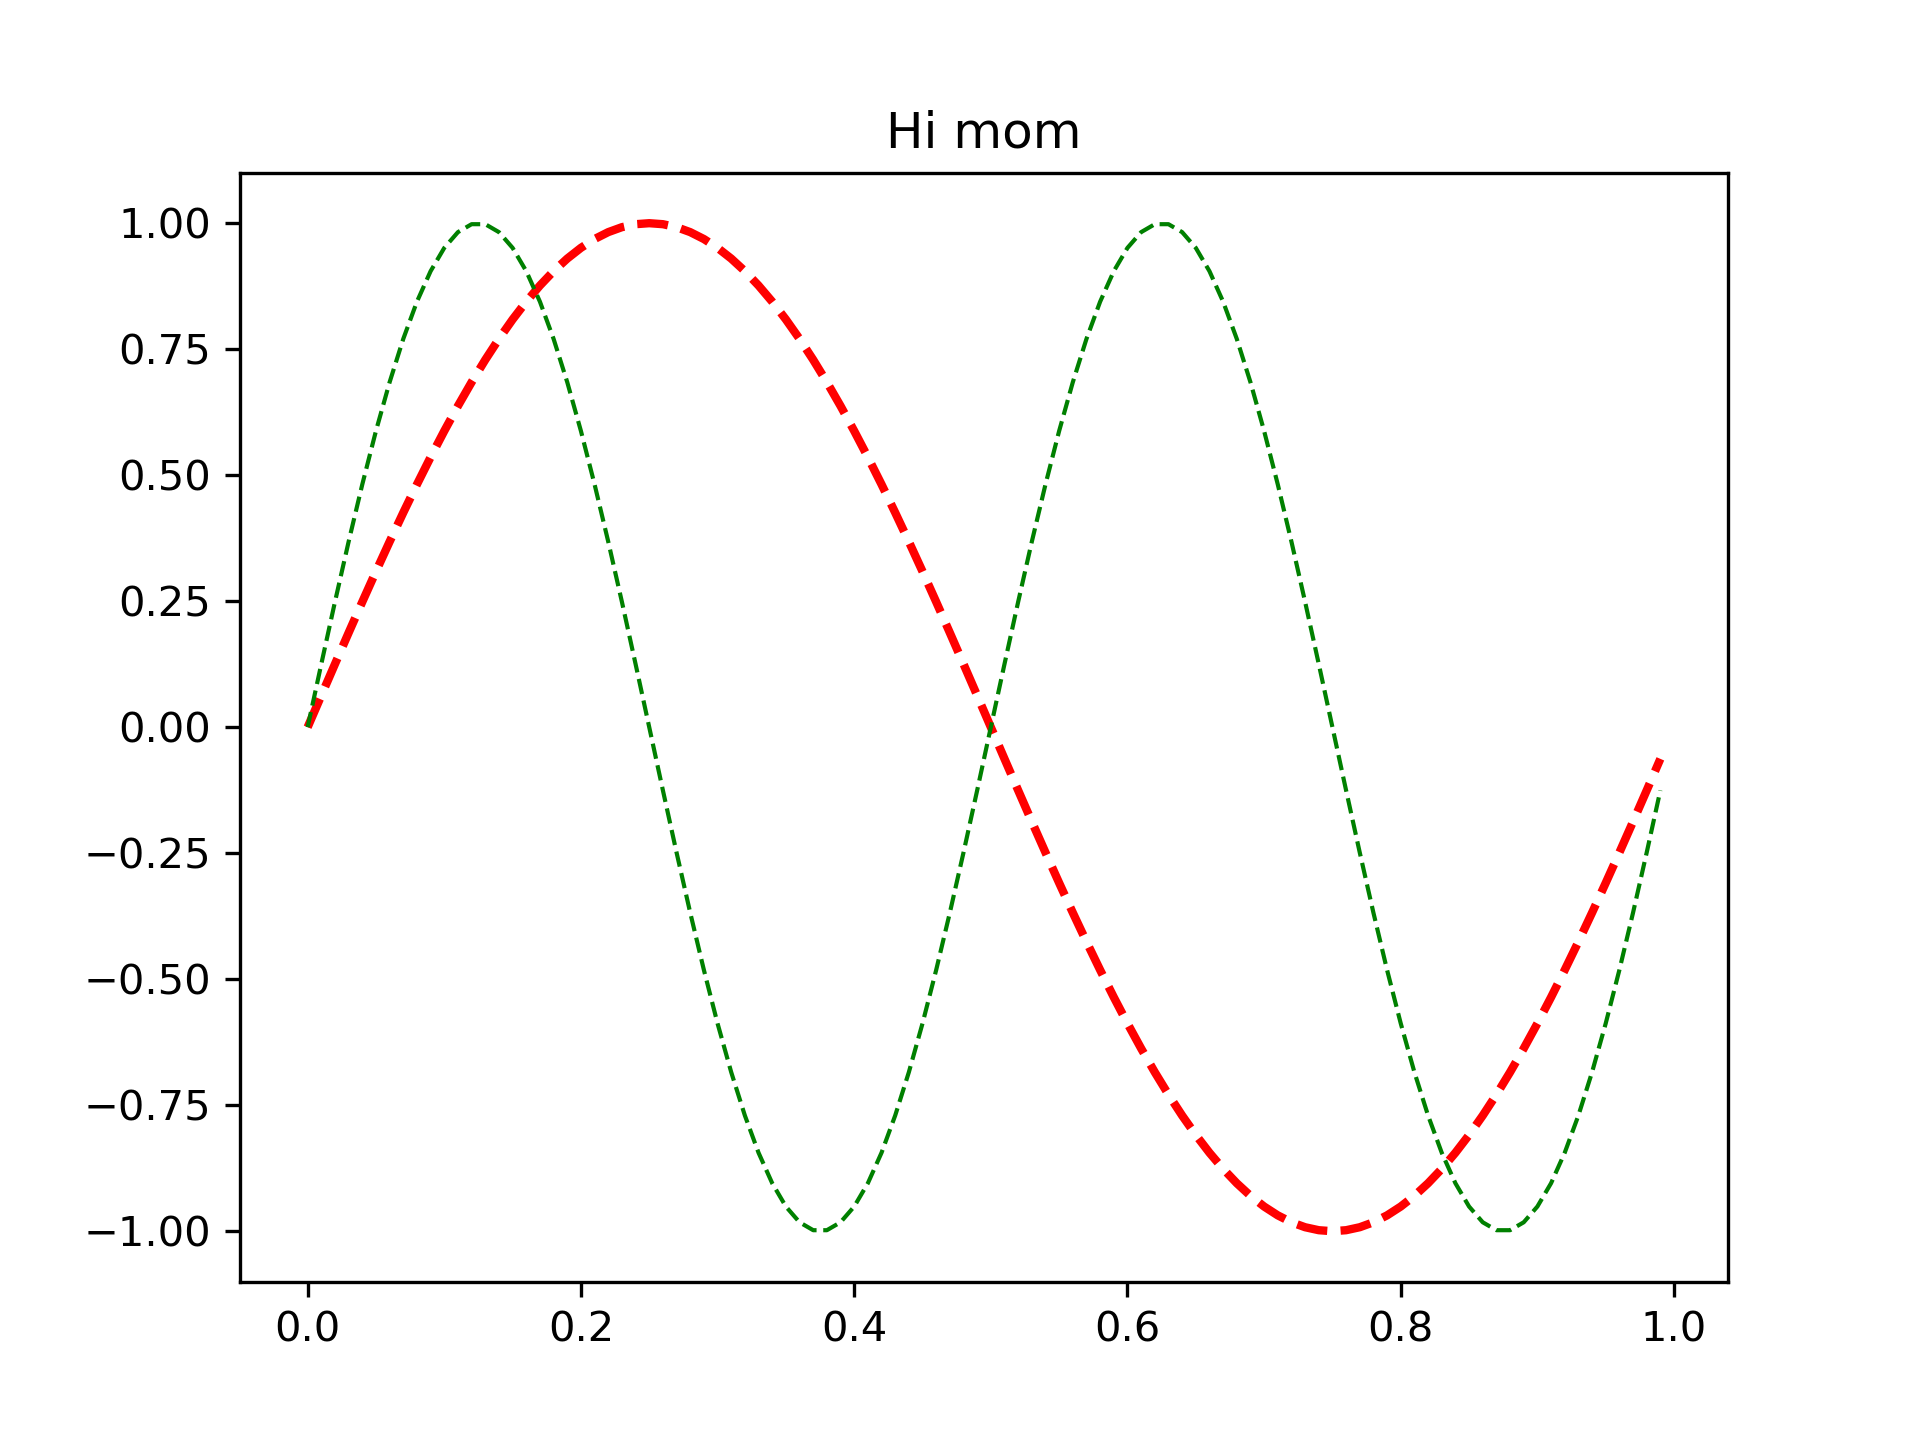
... x = np.arange(0, 1.0, 0.01)
... y1 = np.sin(2*np.pi*x)
... y2 = np.sin(4*np.pi*x)
... lines = plt.plot(x, y1, x, y2)
... l1, l2 = lines
... plt.setp(lines, linestyle='--') # set both to dashed
... plt.setp(l1, linewidth=2, color='r') # line1 is thick and red
... plt.setp(l2, linewidth=1, color='g') # line2 is thinner and green
...
...
... print('Line setters')
... plt.setp(l1)
... print('Line getters')
... plt.getp(l1)
...
... print('Rectangle setters')
... plt.setp(plt.gca().patch)
... print('Rectangle getters')
... plt.getp(plt.gca().patch)
...
... t = plt.title('Hi mom')
... print('Text setters')
... plt.setp(t)
... print('Text getters')
... plt.getp(t)
...
... plt.show()
...